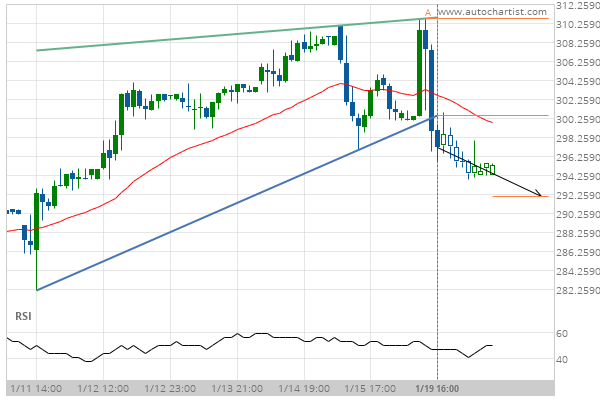
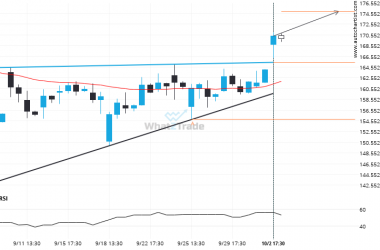
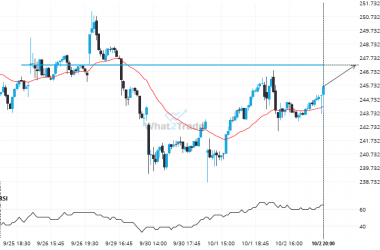
Goldman Sachs Group Inc. has broken through a support line of a Rising Wedge chart pattern. If this breakout holds true, we expect the price of Goldman Sachs Group Inc. to test 291.97 within the next 12 hours. But don’t be so quick to trade, it has tested this line in the past, so you should probably confirm the breakout before placing any trades.
Related Posts
If you’re short AAPL you should be aware that 257.2950 has just been breached – a level tested 3 time in the past
AAPL is once again retesting a key horizontal resistance level at 257.2950. It has tested this level 3…
AMD – breach of a trending resistance line that has been tested at least twice before.
The breakout of AMD through the resistance line of a Ascending Triangle could be a sign of the…
GOOGL keeps moving closer towards 247.2200. Will it finally breach this level?
GOOGL is moving towards a line of 247.2200 which it has tested numerous times in the past. We…


