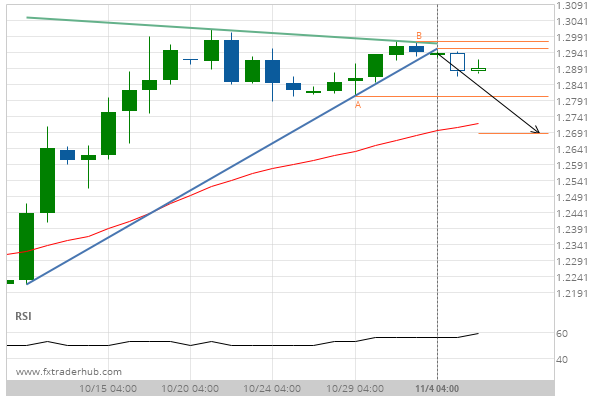
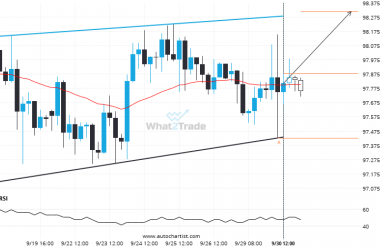
GBP/USD has broken through a support line of a Triangle chart pattern. If this breakout holds true, we expect the price of GBP/USD to test 1.2685 within the next 5 days. But don’t be so quick to trade, it has tested this line in the past, so you should probably confirm the breakout before placing any trades.
Related Posts
EURCHF reached 0.936355 after a 0.33% move spanning 6 hours.
EURCHF recorded an exceptional 0.33% move over the last 6 hours. Whether you follow trends or look for…
If AUDNZD touches 1.1342 it may be time to take action.
AUDNZD is heading towards a line of 1.1342. If this movement continues, the price of AUDNZD could test…
Because AUDJPY formed a Channel Up pattern, we expect it to touch the resistance line. If it breaks through resistance it may move much higher
A Channel Up pattern was identified on AUDJPY at 97.879, creating an expectation that it may move to…

