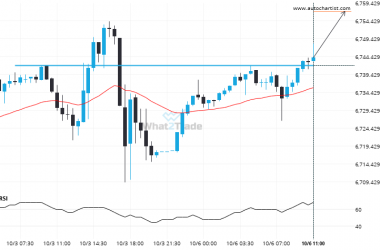
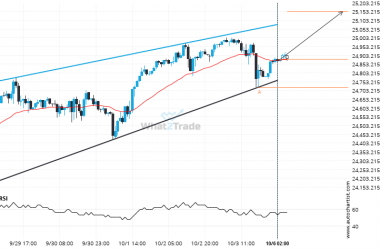
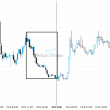
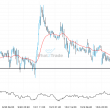
FRA40 has broken through a support line of a Triangle chart pattern. If this breakout holds true, we expect the price of FRA40 to test 5779.4148 within the next 7 days. But don’t be so quick to trade, it has tested this line in the past, so you should probably confirm the breakout before placing any trades.
Related Posts
US 500 keeps moving closer towards 6277.8501. Will it finally breach this level?
US 500 is heading towards a line of 6277.8501. If this movement continues, the price of US 500…
After testing resistance twice in the past, US 500 has finally broken through. Can we expect a bullish trend to follow?
You would be well advised to confirm the breakout that has just occurred – do you believe the…
NAS 100 seems to be on its way to support – a possible opportunity?
NAS 100 is moving towards a key support level at 22608.2832. NAS 100 has previously tested this level…