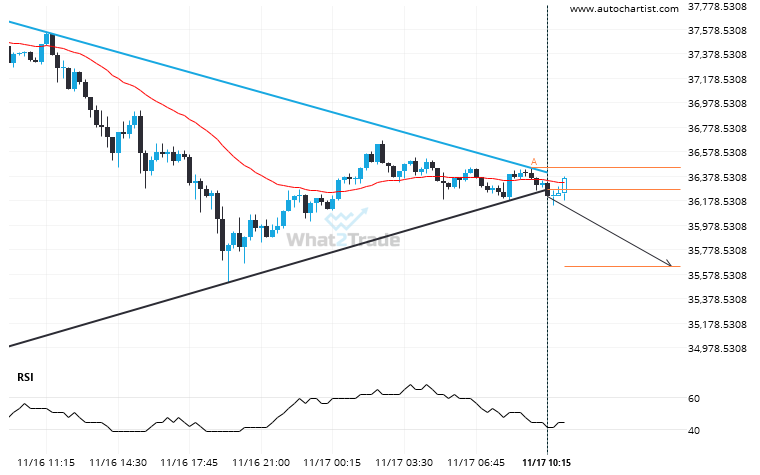
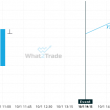
BTCUSD moved through the support line of a Triangle at 36271.92980392157 on the 15 Minutes chart. This line has been tested a number of times in the past and this breakout could mean an upcoming change from the current trend. It may continue in its current direction toward 35643.0467.
Related Posts
A possible move by BTCUSD towards 115838.1303
The breakout of BTCUSD through the support line of a Channel Up could be a sign of the…
A final push possible on LTCEUR as it starts approaching a price line of 107.6900.
LTCEUR is moving towards a key resistance level at 107.6900. This is a previously tested level for LTCEUR.…
BTCAUD has broken through support of a Rising Wedge. It has touched this line at least twice in the last 8 days.
Rising Wedge pattern identified on BTCAUD has broken through a support level with the price momentum continuing to…