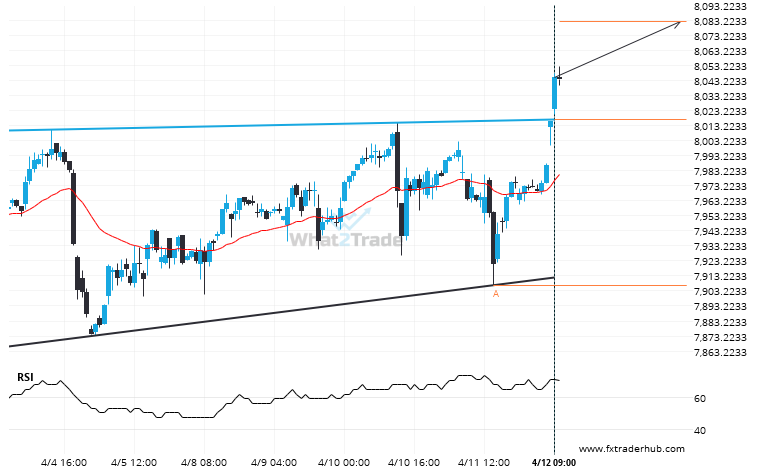
UK100 has broken through a resistance line of a Ascending Triangle chart pattern. If this breakout holds true, we may see the price of UK100 testing 8082.4097 within the next 2 days. But don’t be so quick to trade, it has tested this line in the past, so you should confirm the breakout before taking any action.
Related Posts
Extreme movement experienced on DAX 40. Check the chart to see what to do next.
DAX 40 just posted a 1.37% move over the past 2 days – a move that won’t go…
After testing 23751.1992 numerous times, DAX 40 has finally broken through. Can we expect a bullish trend to follow?
DAX 40 has broken through a resistance line. Because we have seen it retrace from this price in…
Important support line being approached by DOW 30. This price has been tested numerous time in the last 19 days
DOW 30 is moving towards a support line which it has tested numerous times in the past. We…

