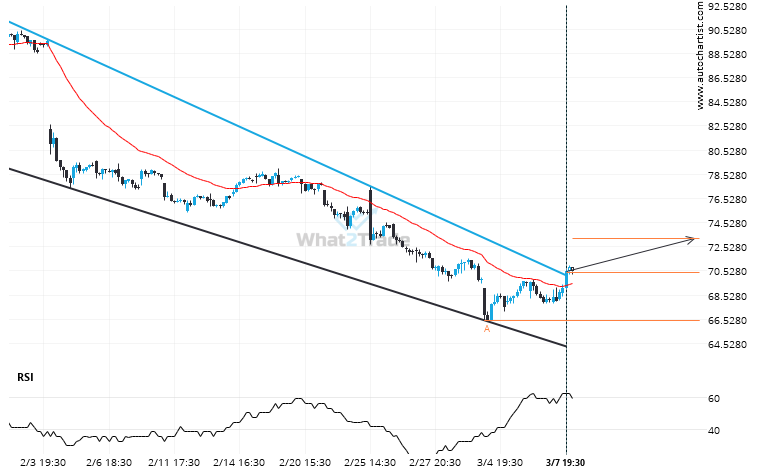
PYPL moved through the resistance line of a Channel Down at 70.38131313131312 on the 1 hour chart. This line has been tested a number of times in the past and this breakout could mean an upcoming change from the current trend. It may continue in its current direction toward 73.2138.
Related Posts
Support line breached by XOM. This price has been tested at least twice before.
XOM has broken through a support line of a Triangle and suggests a possible movement to 102.8407 within…
AMZN has broken through support of a Rising Wedge. It has touched this line at least twice in the last 31 days.
AMZN has broken through a support line of a Rising Wedge chart pattern. If this breakout holds true,…
AAPL heading towards a price it has tested 5 times in the recent past.
AAPL is moving towards a line of 209.3100 which it has tested numerous times in the past. We…