


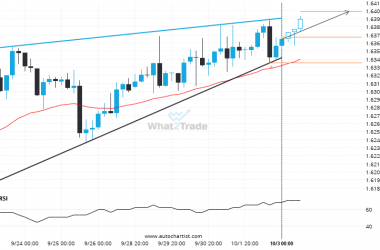
NZD/USD has broken through a resistance line of a Triangle chart pattern. If this breakout holds true, we may see the price of NZD/USD testing 0.6726 within the next 2 days. But don’t be so quick to trade, it has tested this line in the past, so you should confirm the breakout before taking any action.
Related Posts
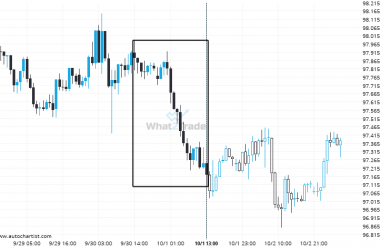
Important resistance line being approached by EURCAD. This price has been tested numerous time in the last 12 days
The movement of EURCAD towards the resistance line of a Rising Wedge is yet another test of the…
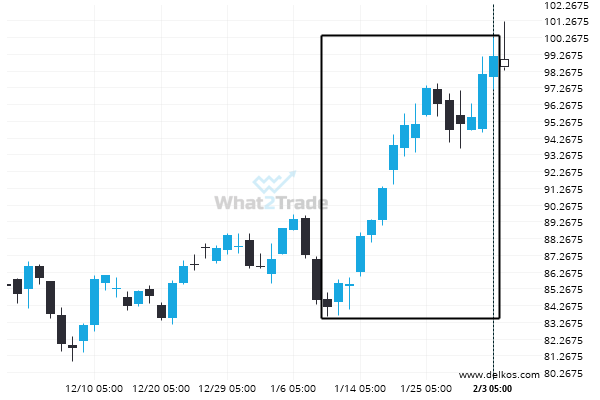
AUDJPY – Large moves like this tend to draw attention.
AUDJPY reached 97.175 after a 0.72% move spanning 23 hours.
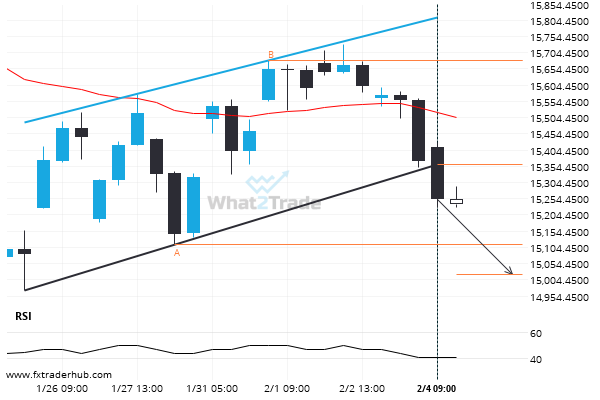
EURAUD is quickly approaching the support line of a Triangle. We expect either a breakout through this line or a rebound.
Emerging Triangle pattern in its final wave was identified on the EURAUD 1 hour chart. After a strong…