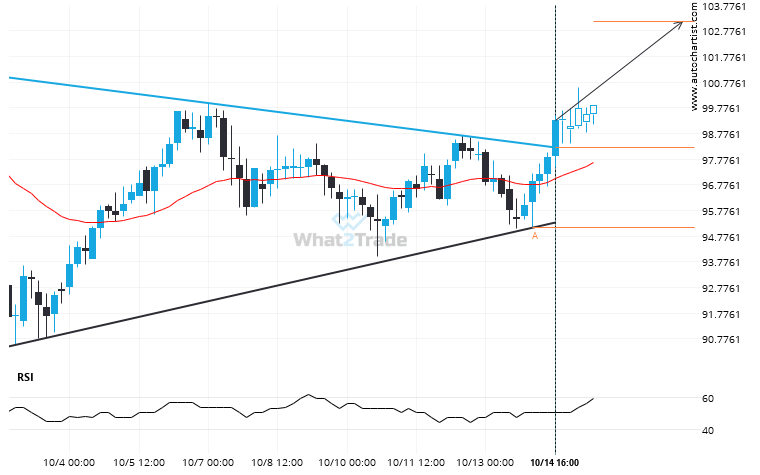
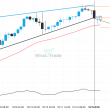
LTCAUD moved through the resistance line of a Triangle at 98.23181818181817 on the 4 hour chart. This line has been tested a number of times in the past and this breakout could mean an upcoming change from the current trend. It may continue in its current direction toward 103.1424.
Related Posts
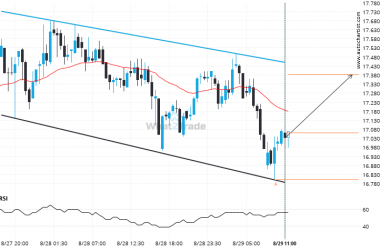
A Channel Down has formed, DASHGBP is approaching support. Can we expect a breakout and the start of a new trend or a reversal?
DASHGBP is trapped in a Channel Down formation, implying that a breakout is Imminent. This is a great…
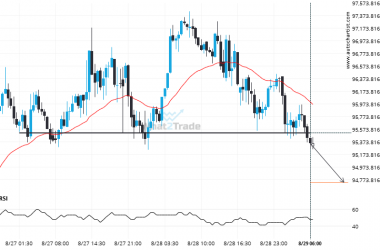
After trying numerous times in the past, BTCEUR finally breaks 95512.3828!
A strong support level has been breached at 95512.3828 on the 30 Minutes BTCEUR chart. Technical Analysis theory…
Interesting opportunity on LTCEUR after breaking 96.78823529411765
The last 5 30 Minutes candles on LTCEUR formed a Triangle pattern and broken out through the pattern…

