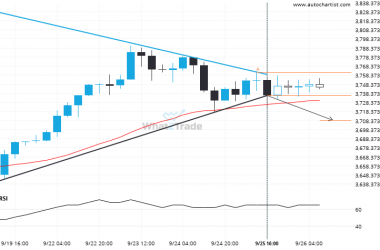
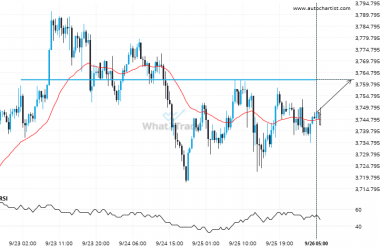
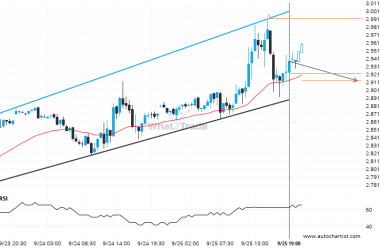
Gold FEBRUARY 2020 has broken through a resistance line of a Triangle chart pattern. If this breakout holds true, we expect the price of Gold FEBRUARY 2020 to test 1551.0233 within the next 7 hours. But don’t be so quick to trade, it has tested this line in the past, so you should probably confirm the breakout before placing any trades.
Related Posts
Gold Spot – breach of a trending support line that has been tested at least twice before.
This trade setup on Gold Spot is formed by a period of consolidation; a period in which the…
Gold Spot seems to be on its way to resistance – a possible opportunity?
Gold Spot is approaching a resistance line at 3761.6851. If it hits the resistance line, it may break…
Important support line being approached by Natural Gas. This price has been tested numerous time in the last 3 days
A Channel Up pattern was identified on Natural Gas at 2.9215, creating an expectation that it may move…

