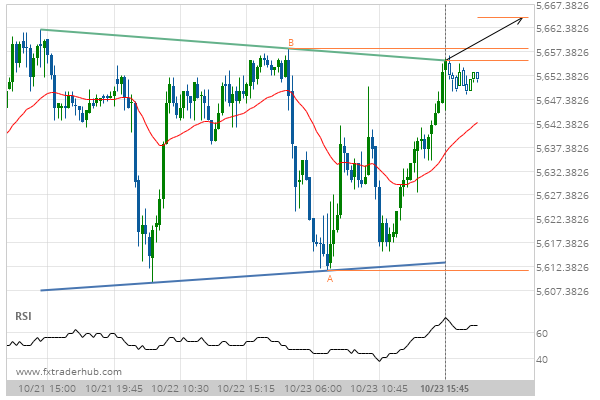
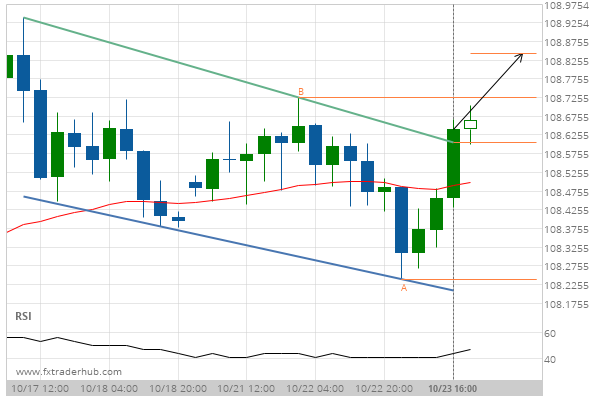
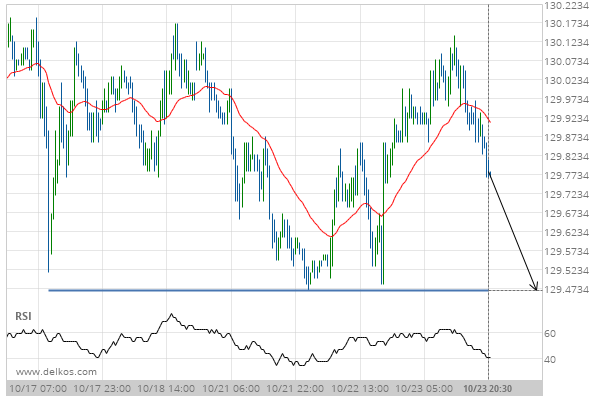
FRA40 has broken through a resistance line of a Rectangle chart pattern. If this breakout holds true, we expect the price of FRA40 to test 5664.5263 within the next 7 hours. But don’t be so quick to trade, it has tested this line in the past, so you should probably confirm the breakout before placing any trades.
Related Posts
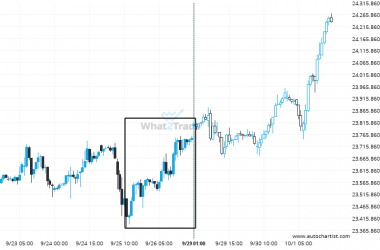
Big bullish swing on DAX 40 – this may be one of its more notable movements in the recent session.
A movement of 1.66% over 4 days on DAX 40 doesn’t go unnoticed. You may start considering where…
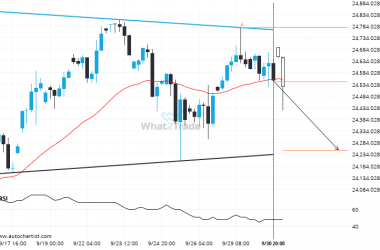
A possible move on NAS 100 as it heads towards support
NAS 100 is approaching the support line of a Triangle. It has touched this line numerous times in…
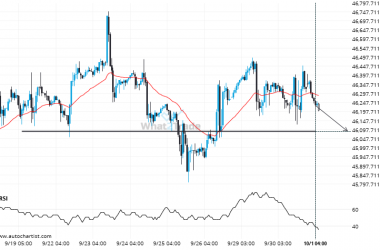
DOW 30 is approaching 46089.0000. We expect either a breakout through this line, or a rebound.
DOW 30 is heading towards a line of 46089.0000. If this movement continues, the price of DOW 30…

