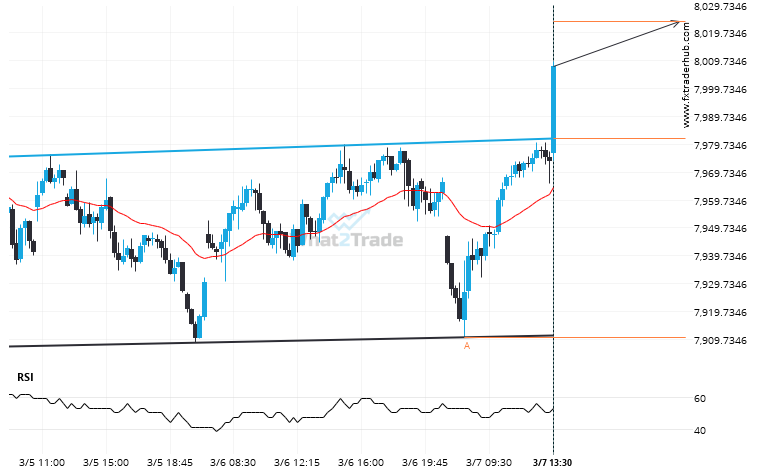
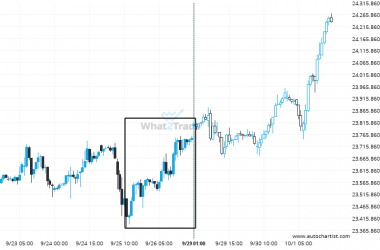
FRA40 moved through the resistance line of a Rectangle at 7981.985507246377 on the 15 Minutes chart. This line has been tested a number of times in the past and this breakout could mean an upcoming change from the current trend. It may continue in its current direction toward 8023.8950.
Related Posts
Nikkei 225 is signaling a possible trend reversal on the intraday charts with price not breaching support.
Nikkei 225 was identified at around 43994.0 having recently rebounded of the support on the 4 hour data…
FTSE 100 is quickly approaching a very important level it has previously tested numerous times in the past
FTSE 100 is approaching a support line at 9120.0000. If it hits the support line, it may break…
NAS 100 – approaching a resistance line that has been previously tested at least twice in the past
Emerging Rising Wedge detected on NAS 100 – the pattern is an emerging one and has not yet…