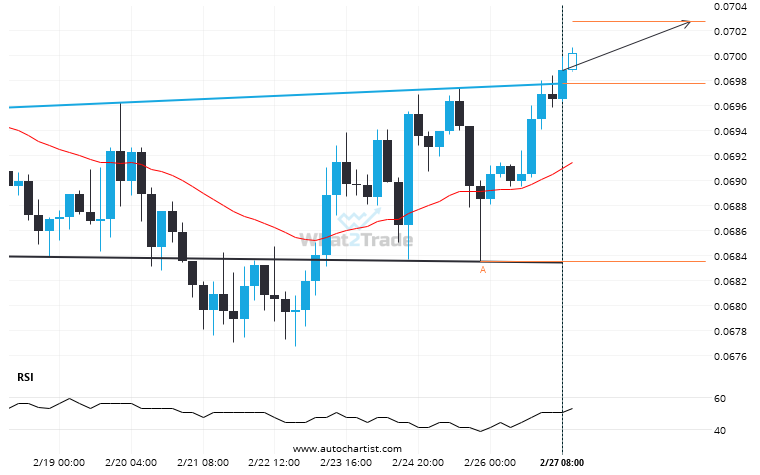
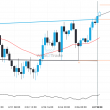
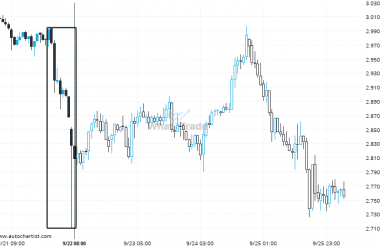
ETHBTC has broken through a resistance line of a Inverse Head and Shoulders chart pattern. If this breakout holds true, we may see the price of ETHBTC testing 0.0703 within the next 3 days. But don’t be so quick to trade, it has tested this line in the past, so you should confirm the breakout before taking any action.
Related Posts
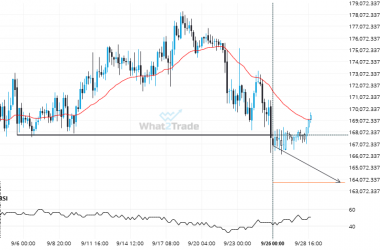
Breach of 167826.2344 could mean a start of a bearish trend on BTCAUD
The breakout of BTCAUD through the 167826.2344 price line is a breach of an important psychological price that…
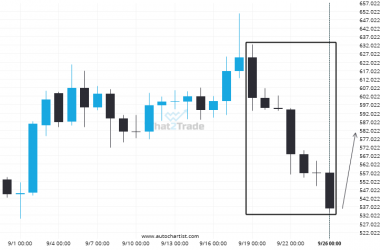
BCHUSD recorded 7 consecutive daily bearish candles reaching 536.0100.
BCHUSD experienced a high number of bearish candles reaching 536.0100 over 8 days.
XRPUSD reached 2.808 after a 6.15% move spanning 10 hours.
XRPUSD recorded a considerable move in the last 10 hours — one of its biggest in recent sessions.

