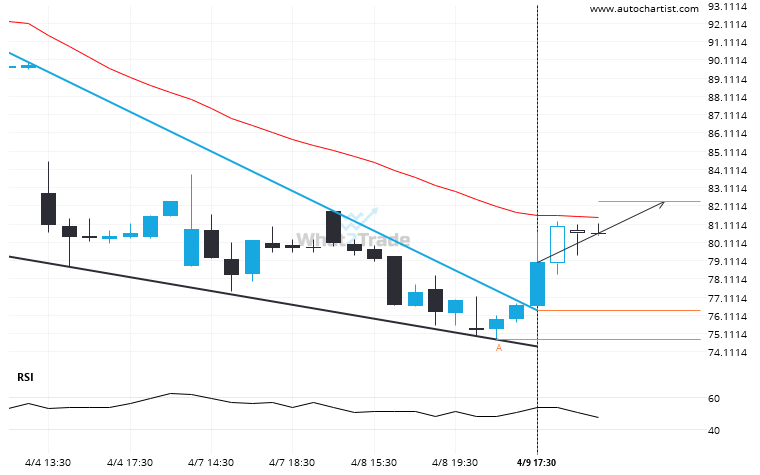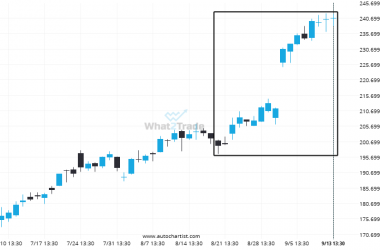
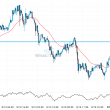
BIDU moved through the resistance line of a Falling Wedge at 76.3833333333333 on the 1 hour chart. This line has been tested a number of times in the past and this breakout could mean an upcoming change from the current trend. It may continue in its current direction toward 82.3657.
Breach of resistance could mean a start of a bullish trend on BIDU