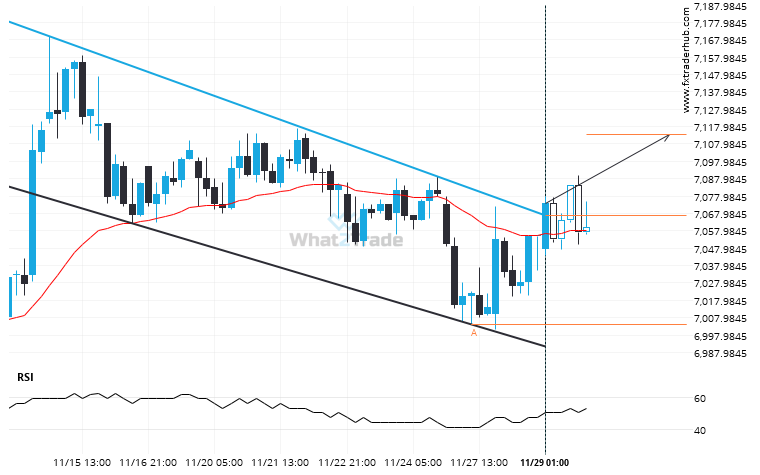
You would be well advised to confirm the breakout that has just occurred – do you believe the move through resistance to be significant? Do you have confirming indicators that the price momentum will continue? If so, look for a target of 7113.6729 but consider reducing the size of your position as the price gets closer to that target.
Related Posts
NAS 100 recorded 5 consecutive 4 hour bullish candles over 20 hours.
NAS 100 experienced a high number of bullish candles reaching 23523.3633 over 20 hours.
After testing 42973.0000 numerous times, Nikkei 225 is once again approaching this price point. Can we expect a bullish trend to follow?
Nikkei 225 is moving towards a key resistance level at 42973.0000. This is a previously tested level for…
Important resistance line being approached by FTSE 100. This price has been tested numerous time in the last 8 days
FTSE 100 is heading towards the resistance line of a Rising Wedge. If this movement continues, the price…