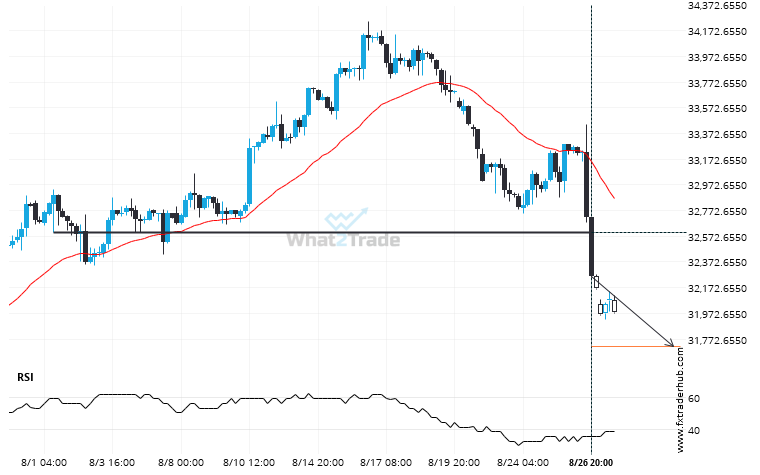
US30 has broken through a line of 32601.0000. If this breakout holds true, we could see the price of US30 heading towards 31712.9004 within the next 3 days. But don’t be so quick to trade, it has tested this line numerous times in the past, so you should probably confirmation the breakout before placing any trades.
Related Posts
FTSE 100 is signaling a possible trend reversal on the intraday charts with price not breaching resistance.
An emerging Channel Up has been detected on FTSE 100 on the 4 hour chart. There is a…
After testing 44490.4492 numerous times, DOW 30 has finally broken through. Can we expect a bearish trend to follow?
DOW 30 has broken through 44490.4492 which it has tested numerous times in the past. We have seen…
US 500 has broken through resistance of a Triangle. It has touched this line at least twice in the last 6 days.
US 500 has broken through a resistance line of a Triangle chart pattern. If this breakout holds true,…