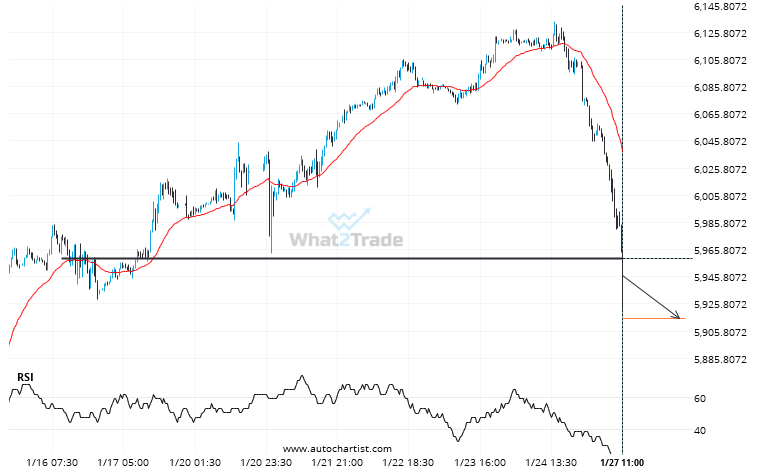
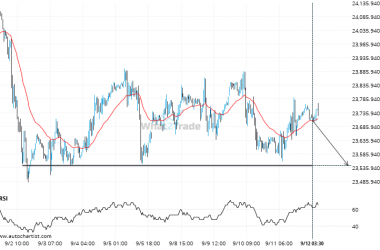
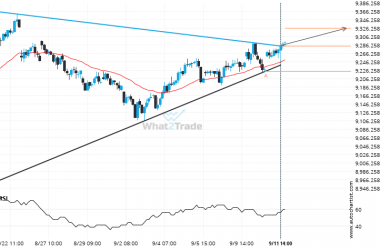
US 500 has broken through a support line. It has touched this line numerous times in the last 12 days. This breakout shows a potential move to 5915.1670 within the next 2 days. Because we have seen it retrace from this level in the past, one should wait for confirmation of the breakout.
Related Posts
NAS 100 is signaling a possible trend reversal on the intraday charts with price not breaching support.
NAS 100 is heading towards the resistance line of a Rising Wedge. If this movement continues, the price…
If DAX 40 touches 23544.0000 it may be time to take action.
DAX 40 is en route to a very important line that will be a definite deciding factor of…
FTSE 100 breakout from a Triangle trade setup. Will it continue this trend to hit the target price?
This trade setup on FTSE 100 is formed by a period of consolidation; a period in which the…


