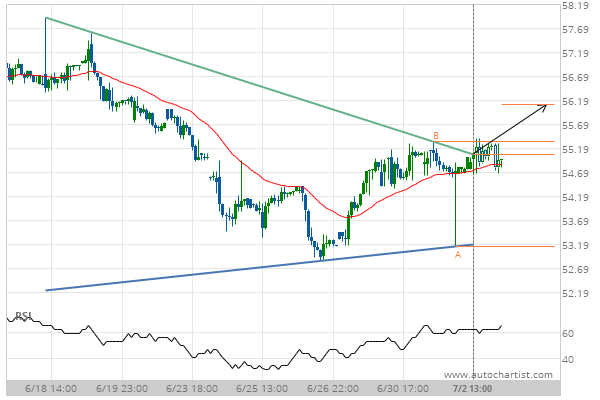
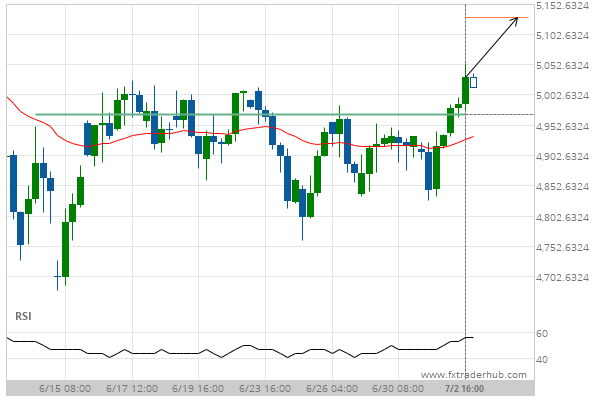
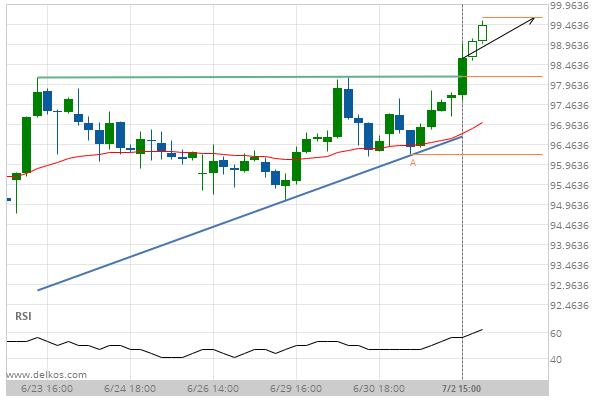
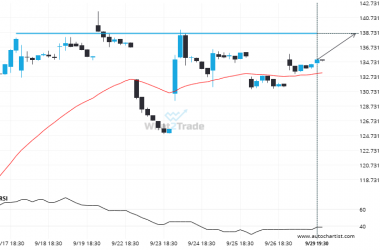
Verizon Communications Inc. has broken through a resistance line of a Triangle and suggests a possible movement to 56.10 within the next 2 days. It has tested this line in the past, so one should probably wait for a confirmation of this breakout before placing a trade. If the breakout doesn’t confirm, we could see a retracement back to lines seen in the last 15 days.
Related Posts
ADBE is approaching a resistance line of a Rising Wedge. It has touched this line numerous times in the last 49 days.
The movement of ADBE towards the resistance line of a Rising Wedge is yet another test of the…
META recorded 6 consecutive 4 hour bearish candles reaching 743.4800.
META experienced an unusual number of bearish candles on the 4 hour timeframe.
Important price line being approached by BIDU. This price has been tested numerous times before.
BIDU is approaching a resistance line at 138.5250. If it hits the resistance line, it may break through…

