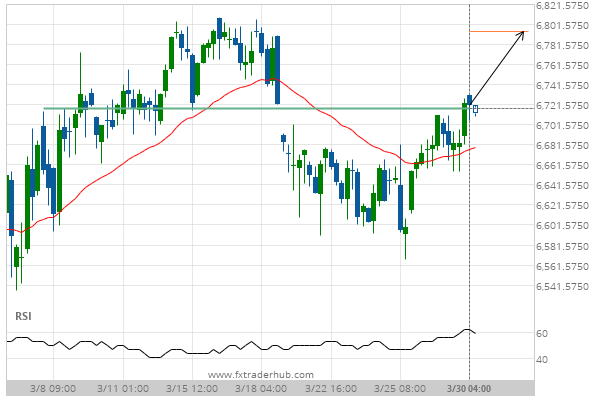
UK100 has broken through a line of 6717.5000 and suggests a possible movement to 6794.3501 within the next 4 days. It has tested this line numerous times in the past, so one should probably wait for a confirmation of this breakout before placing a trade. If the breakout doesn’t confirm, we could see a retracement back to lines seen in the last 23 days.
Related Posts
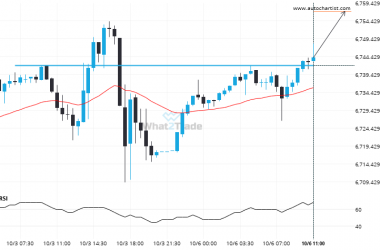
After testing 6741.8398 numerous times, US 500 has finally broken through. Can we expect a bullish trend to follow?
The price of US 500 in heading in the direction of 6757.0430. Despite the recent breakout through 6741.8398…
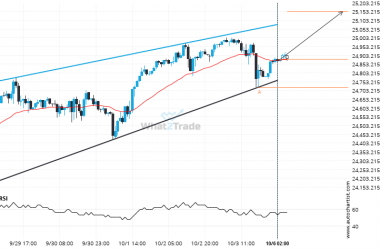
NAS 100 is approaching a resistance line of a Rising Wedge. It has touched this line numerous times in the last 11 days.
NAS 100 is heading towards the resistance line of a Rising Wedge. If this movement continues, the price…
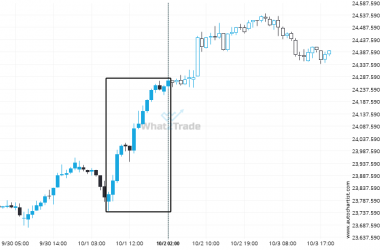
A very large move was recorded on DAX 40. The size of the shift is exceptional.
A movement of 1.93% over 19 hours on DAX 40 doesn’t go unnoticed. You may start considering where…

