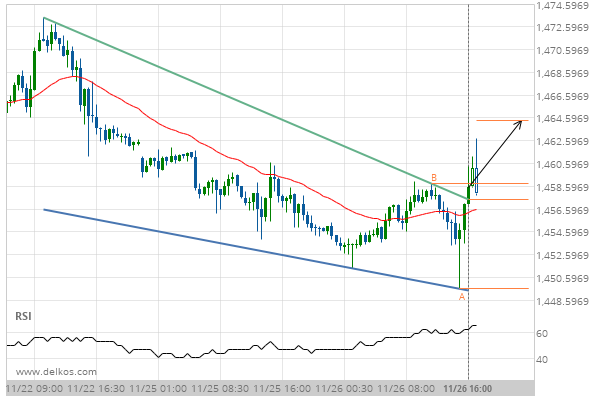
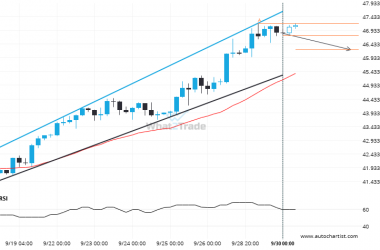
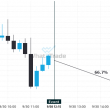
Gold DECEMBER 2019 has broken through a resistance line of a Falling Wedge and suggests a possible movement to 1464.3790 within the next 16 hours. It has tested this line in the past, so one should probably wait for a confirmation of this breakout before placing a trade. If the breakout doesn’t confirm, we could see a retracement back to lines seen in the last 5 days.
Related Posts
A possible move on Brent Crude as it heads towards resistance
Emerging Channel Up pattern in its final wave was identified on the Brent Crude 1 hour chart. After…
Natural Gas is approaching 2.8575. We expect either a breakout through this line, or a rebound.
Natural Gas is about to retest a key horizontal support level near 2.8575. It has tested this level…
Breach of resistance could mean a start of a bullish trend on US Oil
US Oil moved through the resistance line of a Triangle at 64.98008333333334 on the 4 hour chart. This…