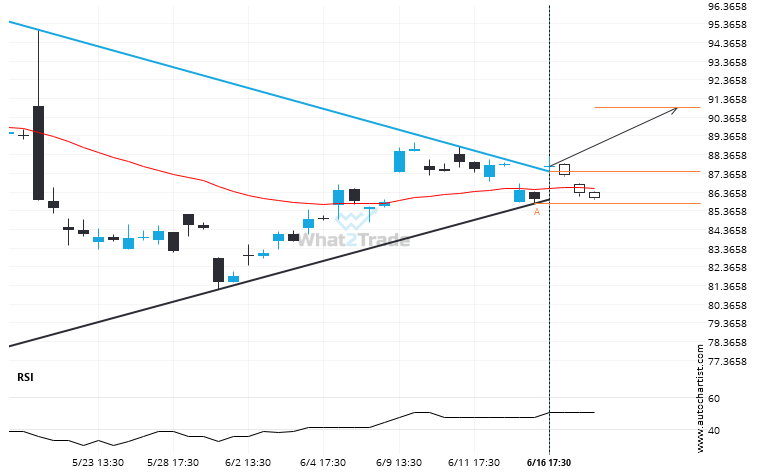
BIDU has broken through a resistance line of a Triangle chart pattern. If this breakout holds true, we may see the price of BIDU testing 90.8876 within the next 15 hours. But don’t be so quick to trade, it has tested this line in the past, so you should confirm the breakout before taking any action.
BIDU broke through a resistance at 2025-06-16T15:30:00.000Z, with the price momentum continuing to move in an upward direction over the next hours, good opportunity presents itself with the price expected to reach 90.8876.