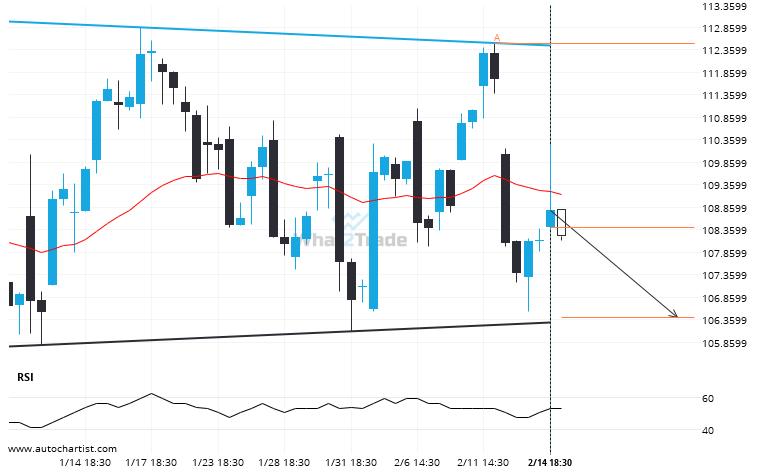
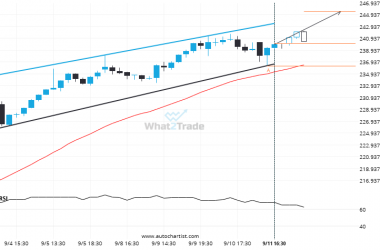
XOM is trapped in a Rectangle formation, implying that a breakout is Imminent. This is a great trade-setup for both trend and swing traders. It is now approaching a resistance line that has been tested in the past. Divergence opportunists may be very optimistic about a possible breakout and this may be the start of a new trend. It may also be that this convergence factor may result in the ideal setup for swing traders that are on the lookout for a possible bounce-back. Whatever happens, an initial move towards 106.4213 is expected in the short term.
Related Posts
MRNA breakout from a Ascending Triangle trade setup. Will it continue this trend to hit the target price?
This trade setup on MRNA is formed by a period of consolidation; a period in which the price…
NVDA is quickly approaching a very important level it has previously tested numerous times in the past
NVDA is heading towards 184.4200 and could reach this point within the next 15 hours. It has tested…
GOOGL formed a Channel Up on the 1 hour chart. Retest of resistance in sight.
GOOGL is heading towards the resistance line of a Channel Up and could reach this point within the…


