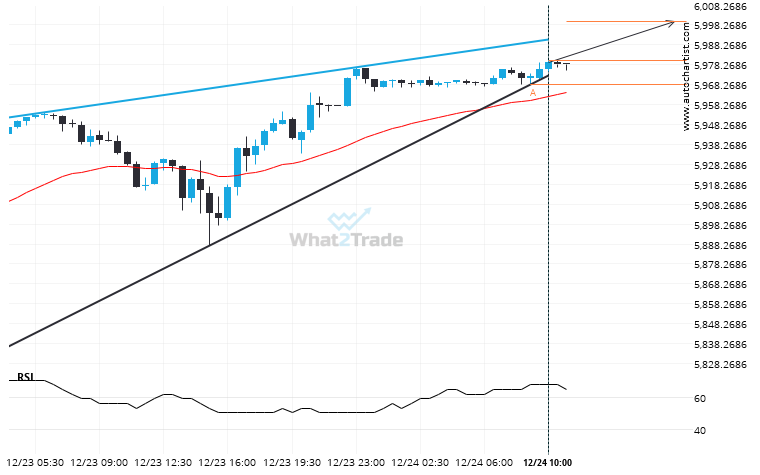
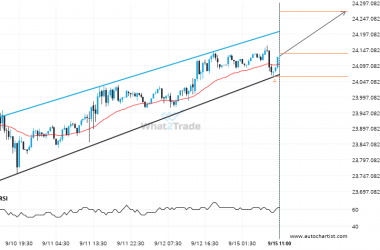
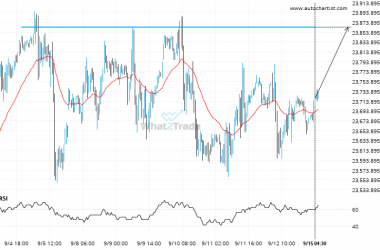
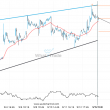
An emerging Rising Wedge has been detected on US 500 on the 30 Minutes chart. There is a possible move towards 6000.0988 next few candles. Once reaching support it may continue its bullish run or reverse back to current price levels.
Related Posts
Supports and resistances are primary concepts of technical analysis. Nikkei 225 is heading for an important price of 37699.0000 – read about what this could mean for the future.
Nikkei 225 is moving towards a key resistance level at 37699.0000. This is a previously tested level for…
An unexpected large move has occurred on FTSE 100 Daily chart! Is this a sign of something new? What can we expect?
For those of you that don’t believe in trends, this may be an opportunity to take advantage of…
NAS 100 formed a Channel Up on the 4 hour chart. Retest of resistance in sight.
An emerging Channel Up has been detected on NAS 100 on the 4 hour chart. There is a…