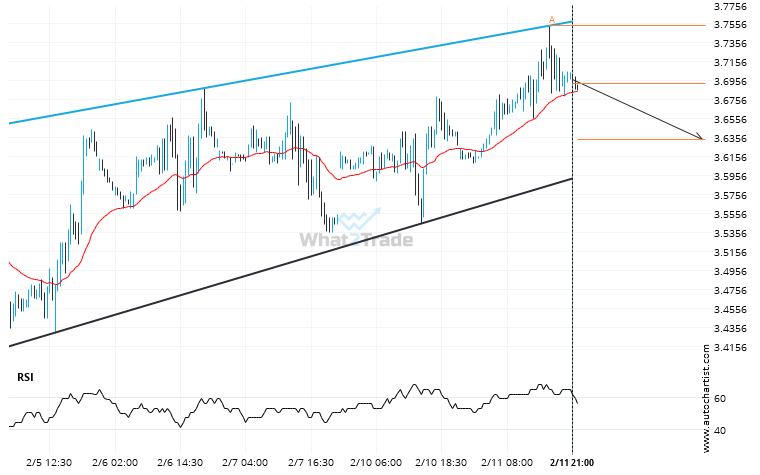
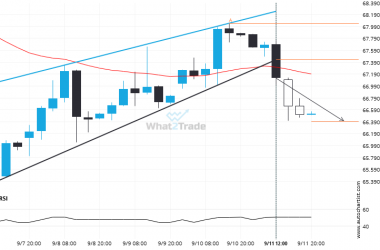
A Channel Up pattern was identified on Natural Gas at 3.693, creating an expectation that it may move to the support line at 3.6338. It may break through that line and continue the bearish trend or it may reverse from that line.
Related Posts
A possible move on Brent Crude as it heads towards support
The movement of Brent Crude towards the support line of a Channel Down is yet another test of…
Gold Spot has broken through a resistance line. It has touched this line numerous times in the last 3 days.
Gold Spot has broken through a line of 3649.8000 and suggests a possible movement to 3664.0825 within the…
Interesting opportunity on Brent Crude after breaking 67.43627777777779
Brent Crude moved through the support line of a Pennant at 67.43627777777779 on the 4 hour chart. This…


