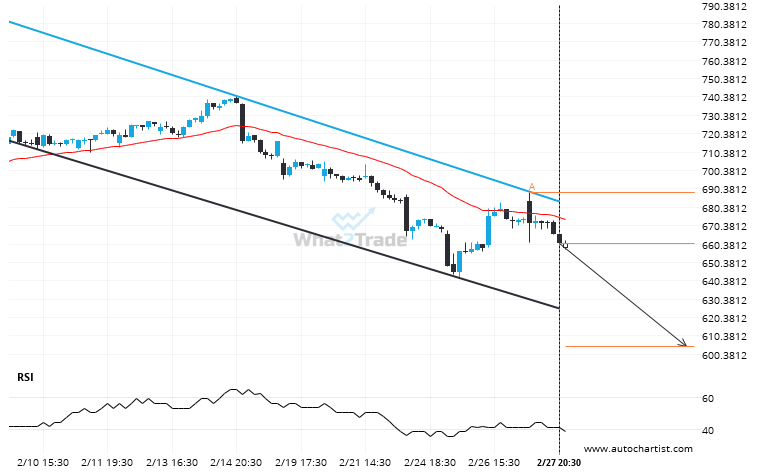
META is moving towards a support line which it has tested numerous times in the past. We have seen it retrace from this line before, so at this stage it isn’t clear whether it will breach this line or rebound as it did before. If META continues in its current trajectory, we could see it reach 604.5386 within the next 2 days.
Because META formed a Channel Down pattern, we expect it to touch the support line. If it breaks through support it may move much lower