
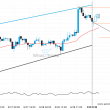
BCHAUD has broken through the support line of a Rising Wedge technical chart pattern. Because we have seen it retrace from this line in the past, one should wait for confirmation of the breakout before taking any action. It has touched this line twice in the last 8 days and suggests a possible target level to be around 464.9755 within the next 3 days.
Related Posts
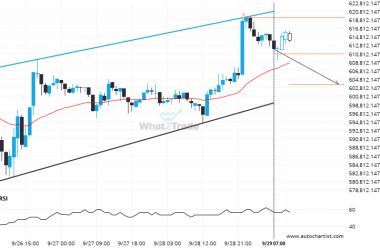
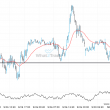
ETHJPY formed a Channel Up on the 1 hour chart. Retest of support in sight.
An emerging Channel Up has been detected on ETHJPY on the 1 hour chart. There is a possible…
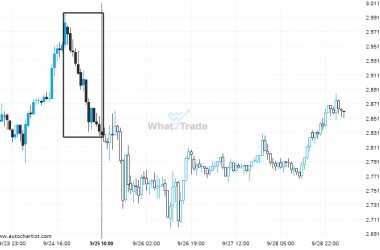
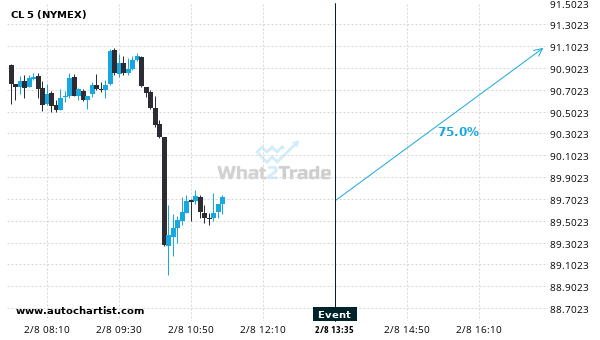
XRPUSD – Large moves like this tend to draw attention.
XRPUSD reached 2.828 after a 5.23% move spanning 15 hours.
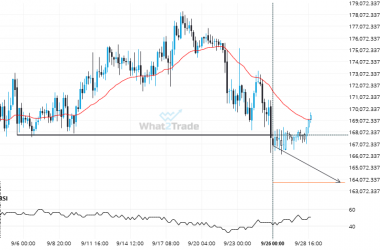
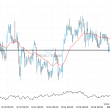
Breach of 167826.2344 could mean a start of a bearish trend on BTCAUD
The breakout of BTCAUD through the 167826.2344 price line is a breach of an important psychological price that…