


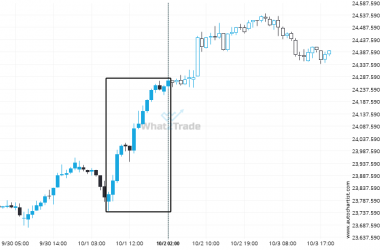
A very large move was recorded on DAX 40. The size of the shift is exceptional.
A movement of 1.93% over 19 hours on DAX 40 doesn’t go unnoticed. You may start considering where…
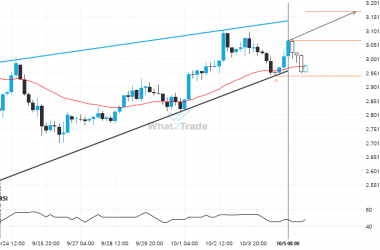
XRPUSD – approaching a resistance line that has been previously tested at least twice in the past
An emerging Rising Wedge has been detected on XRPUSD on the 4 hour chart. There is a possible…
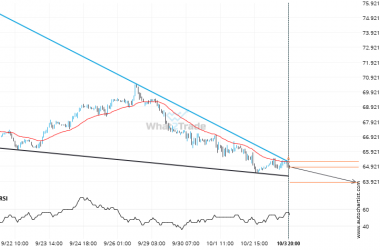
Brent Crude formed a Falling Wedge on the 1 hour chart. Retest of support in sight.
Emerging Falling Wedge detected on Brent Crude – the pattern is an emerging one and has not yet…
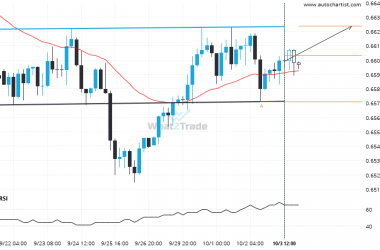
A possible move on AUDUSD as it heads towards resistance
AUDUSD is heading towards the resistance line of a Inverse Head and Shoulders and could reach this point…
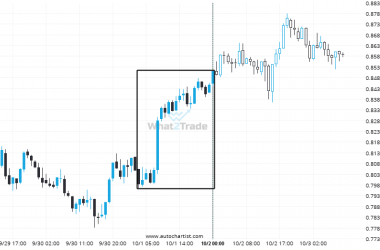
ADAUSD – Large moves like this tend to draw attention.
ADAUSD has moved higher by 6.6% from 0.7985 to 0.8512 in the last 21 hours.
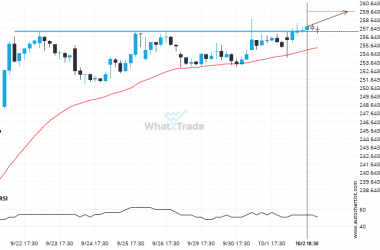
If you’re short AAPL you should be aware that 257.2950 has just been breached – a level tested 3 time in the past
AAPL is once again retesting a key horizontal resistance level at 257.2950. It has tested this level 3…
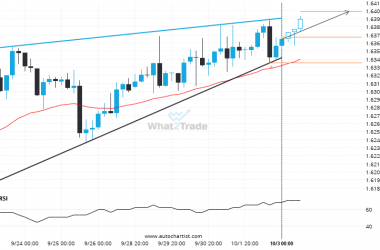
Important resistance line being approached by EURCAD. This price has been tested numerous time in the last 12 days
The movement of EURCAD towards the resistance line of a Rising Wedge is yet another test of the…

FTSE 100 reached 9451.85 after a 1.84% move spanning 2 days.
FTSE 100 recorded a considerable move in the last day — one of its biggest in recent sessions.
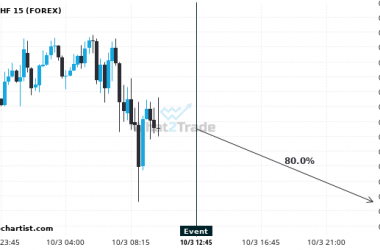
We expect USDCHF to trend downwards today with a 80% chance.
Based on the last 12 Non Farm Payrolls events in United States, we expect a $790 movement on…
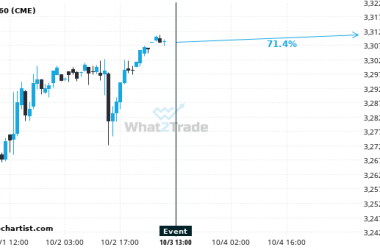
We expect EMD to trend upwards today with a 71.43% chance.
Based on past United States Non Farm Payrolls news events there is a 71.43% chance of EMD trending…