


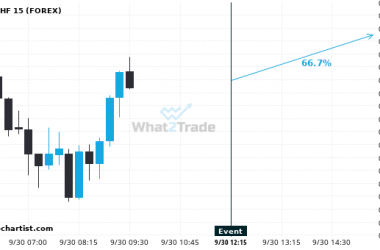
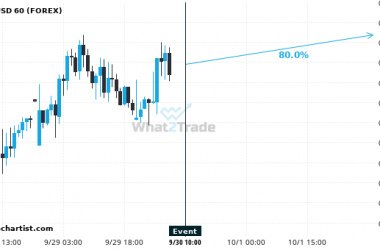
We expect USDCHF to trend upwards today with a 66.67% chance.
We expect USDCHF to trend upwards later today. Based on these past Germany Inflation Rate YoY Prel news…
We expect a $2760 movement on GBPUSD within the next 48 hours.
Based on the last 12 Inflation Rate YoY Prel events in Italy, we may expect GBPUSD to trend…
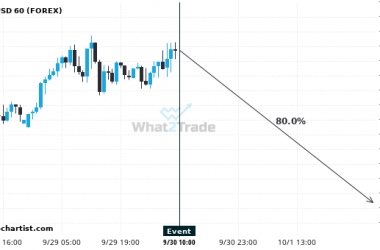
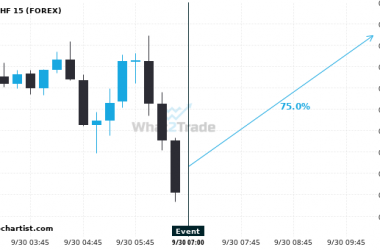
We expect a $12079800 movement on NIY within the next 12 hours.
Based on past Italy Inflation Rate YoY Prel news events there is a 75% chance of NIY trending…
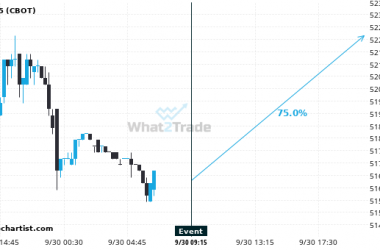
We expect ZW to trend upwards today with a 75% chance.
Based on the last 12 Inflation Rate YoY Prel events in Italy, we expect a 61 pip movement…
We expect a 52 pip movement on NZDUSD within 48 hours following the event release.
Based on the last 12 Inflation Rate YoY Prel events in Italy, we expect NZDUSD to trend upwards…
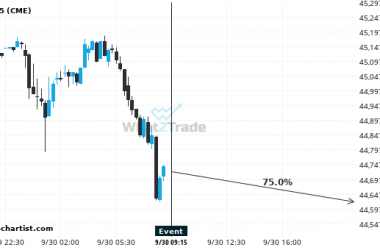
We expect USDCHF to trend upwards with a 75% chance.
Based on the last 12 Inflation Rate YoY Prel events in France, we could see a $602 movement…
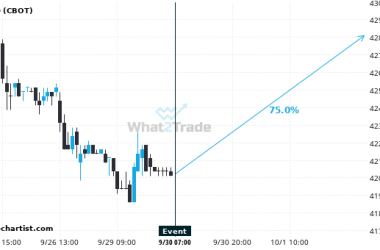
We expect a 6600 pip movement on ZC within 48 hours following the event release.
Based on the last 12 Inflation Rate YoY Prel events in France, we expect ZC to trend upwards…
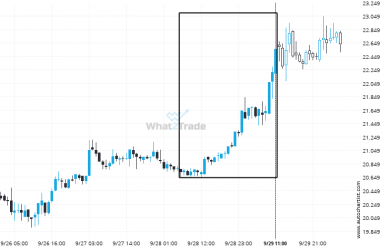
DASHUSD experienced a 8.88% bullish move in just 2 days. The magnitude speaks for itself.
DASHUSD reached 22.56 after a 8.88% move spanning 2 days.
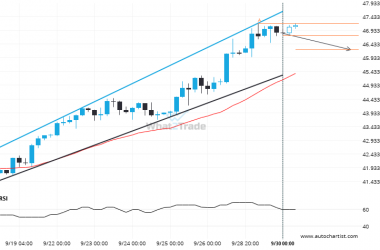
After testing the support line numerous times, Silver Spot is once again approaching this line. Can we expect a bearish trend to follow?
The movement of Silver Spot towards the support line of a Channel Up is yet another test of…
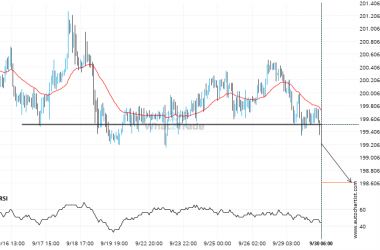
GBPJPY has broken through a support line. It has touched this line numerous times in the last 14 days.
GBPJPY has broken through a line of 199.5125 and suggests a possible movement to 198.6128 within the next…