Autochartist
42979 messages
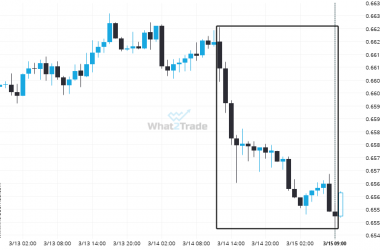
Extreme movement experienced on AUD/USD. Check this chart to see what to do next
AUD/USD has experienced an exceptionally large movement lower by 0.87% from 0.66137 to 0.65564 in the last 21…
Soybeans May 2024 – It’s perhaps in these huge moves where the greatest opportunity lies
For those of you that don’t believe in trends, this may be an opportunity to take advantage of…
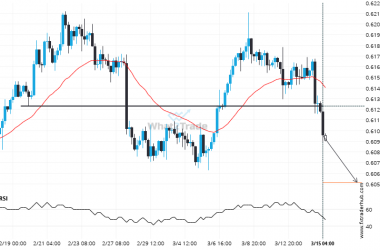
NZD/USD has broken through a support line. It has touched this line numerous times in the last 25 days.
NZD/USD has broken through a support line. It has touched this line numerous times in the last 25…
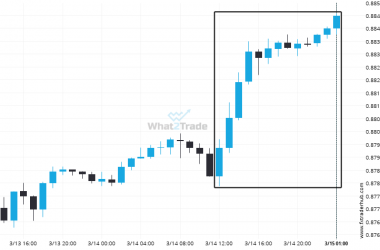
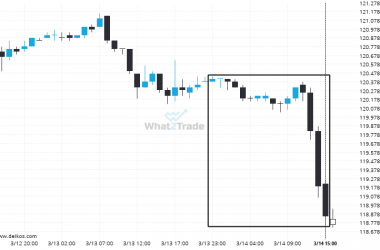
USD/CHF hits 0.88483 after a 0.72% move spanning 13 hours
A movement of 0.72% over 13 hours on USD/CHF doesn’t go unnoticed. You may start considering where it’s…
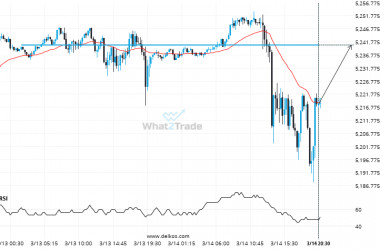
E-Mini S&P 500 June 2024 keeps moving closer towards 5240.5000. Will it finally breach this level?
E-Mini S&P 500 June 2024 is moving towards a key resistance level at 5240.5000. E-Mini S&P 500 June…
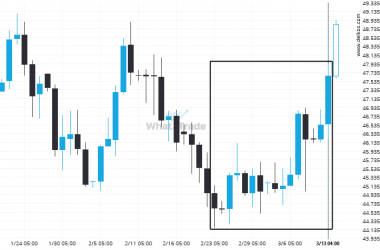
After experiencing a 6.79% bullish move in the space of 19 days, nobody knows where Soybean Oil May 2024 is headed.
Soybean Oil May 2024 has moved higher by 6.79% from 44.62 to 47.65 in the last 19 days.
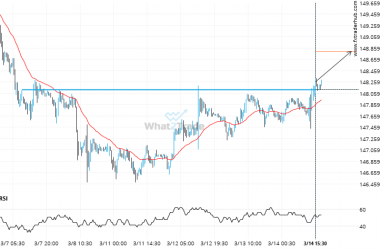
Breach of 148.1210 could mean a start of a bullish trend on USD/JPY
USD/JPY has broken through a line of 148.1210. If this breakout holds true, we could see the price…
Is the extremely large movement on Us Treasury Bond June 2024 a sign of things to come?
A movement of 1.3% over 16 hours on Us Treasury Bond June 2024 doesn’t go unnoticed. You may…
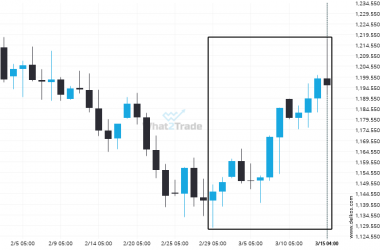
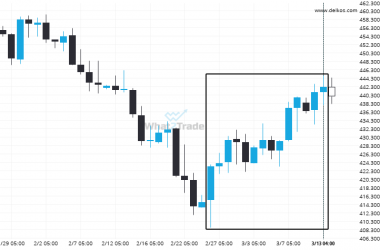
Corn May 2024 moves higher to 442.25 in the last 16 days.
An unexpected large move has occurred on Corn May 2024 Daily chart beginning at 423.25 and ending at…
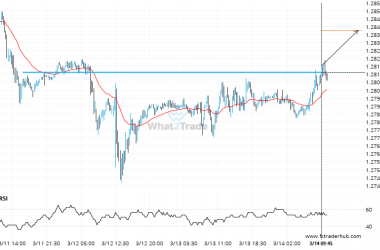
GBP/USD may be on a start of a new bullish trend after its breakout through this important resistance level
GBP/USD has broken through 1.2816 which it has tested numerous times in the past. We have seen it…

