Autochartist
42979 messages
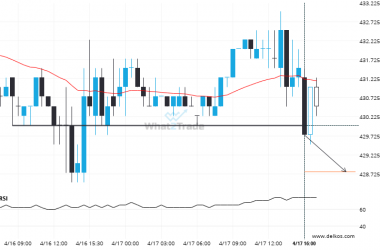
If you’re long Corn May 2024 you should be aware that 430.0000 has just been breached – a level tested 3 time in the past
A strong support level has been breached at 430.0000 on the 30 Minutes Corn May 2024 chart. Technical…
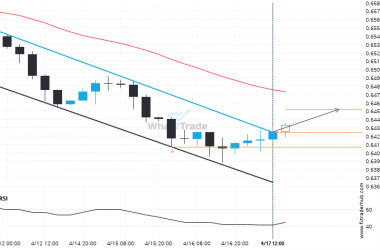
A possible move by AUD/USD towards 0.6454
AUD/USD has broken through a resistance line of a Channel Down chart pattern. If this breakout holds true,…
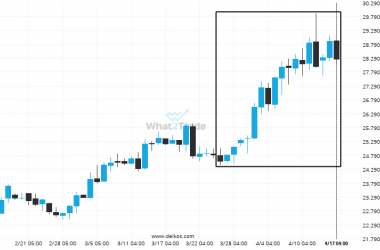
Silver May 2024 hits 28.24 after a 14.98% move spanning 23 days
Silver May 2024 has moved higher by 14.98% from 24.56 to 28.24 in the last 23 days.
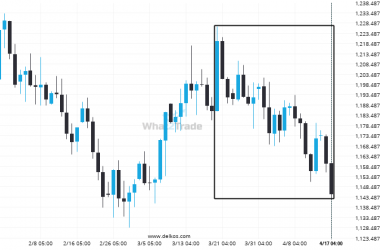
An unexpected large move has occurred on Soybeans May 2024 Daily chart! Is this a sign of something new? What can we expect?
Soybeans May 2024 has experienced an extremely big movement in last 28 days. It may continue the trend,…
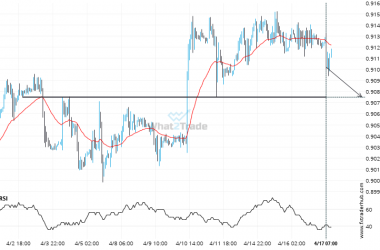
Will USD/CHF break through the support level it tested before?
USD/CHF is about to retest a key horizontal support level near 0.9075. It has tested this level 3…
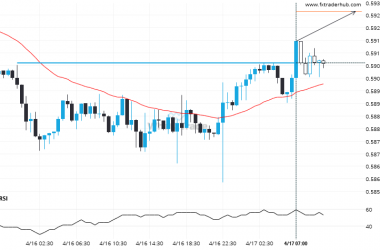
Breach of 0.5908 could mean a start of a bullish trend on NZD/USD
The price of NZD/USD in heading in the direction of 0.5929. Despite the recent breakout through 0.5908 it…
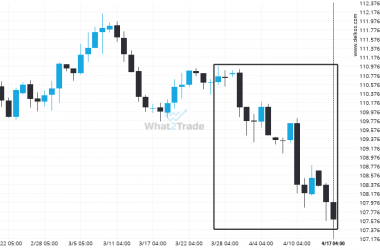
10 Yr Us Treasury Note June 2024 hits 107.59375 after a 2.85% move spanning 22 days
10 Yr Us Treasury Note June 2024 hits 107.59375 after a 2.85% move spanning 22 days.
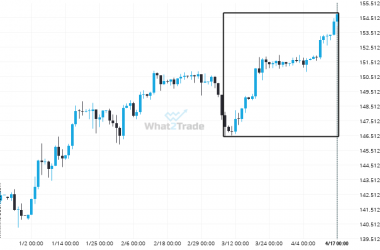
USD/JPY moves higher to 154.699 in the last 41 days.
USD/JPY experienced an extremely large move that lasted 41. This movement is in the 97.0 percentile and is…
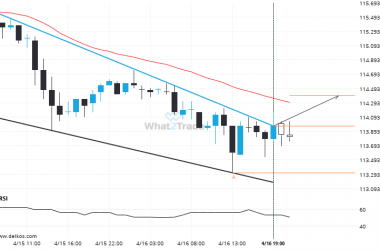
Breach of resistance could mean a start of a bullish trend on Us Treasury Bond June 2024
Us Treasury Bond June 2024 has broken through a resistance line of a Falling Wedge chart pattern. If…
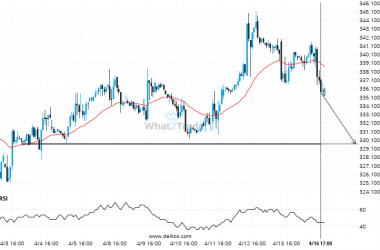
If Soybean Meal May 2024 touches 329.6000 it may be time to take action.
Soybean Meal May 2024 is about to retest a key horizontal support level near 329.6000. It has tested…

