Autochartist
728 messages
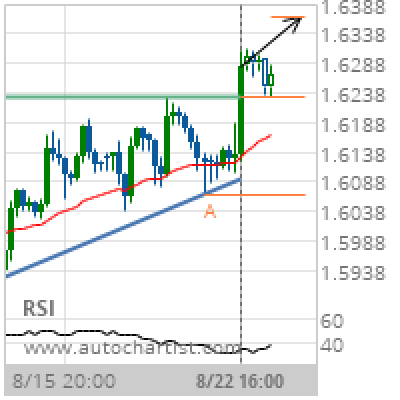
GBP/CAD Target Level: 1.6366
Ascending Triangle has broken through the resistance line at 22-Aug-2019 16:00 UTC. Possible bullish price movement forecast for the next 3 days towards 1.6366. Supported by RSI below 40 Chart 4 hourPattern Ascending TriangleLength 67 CandlesIdentified 22-Aug-2019 16:00 UTC
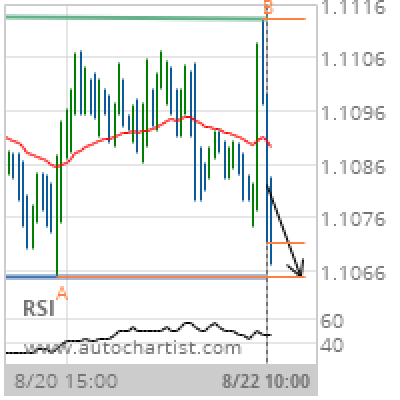
EUR/USD Target Level: 1.1065
Rectangle identified at 22-Aug-2019 10:00 UTC. This pattern is still in the process of forming. Possible bearish price movement towards the support 1.1065 within the next day. Supported by Downward sloping Moving Average Chart 1 hourPattern RectangleLength 93 CandlesIdentified 22-Aug-2019 10:00 UTC
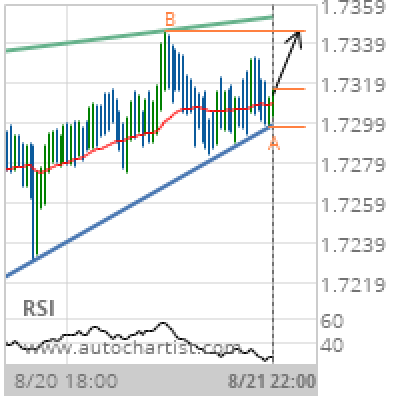
EUR/NZD Target Level: 1.7346
Rising Wedge identified at 21-Aug-2019 22:00 UTC. This pattern is still in the process of forming. Possible bullish price movement towards the resistance 1.7346 within the next 20 hours. Supported by RSI below 40 Chart 30 MinutesPattern Rising WedgeLength 121 CandlesIdentified 21-Aug-2019 22:00 UTC
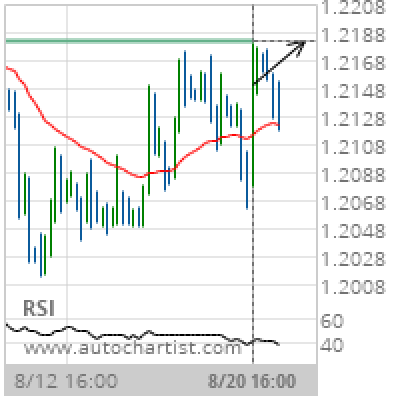
GBP/USD Target Level: 1.2183
Approaching Resistance level of 1.2183 identified at 20-Aug-2019 16:00 UTC Supported by RSI below 40 Chart 4 hourPattern ResistanceLength 81 CandlesIdentified 20-Aug-2019 16:00 UTC
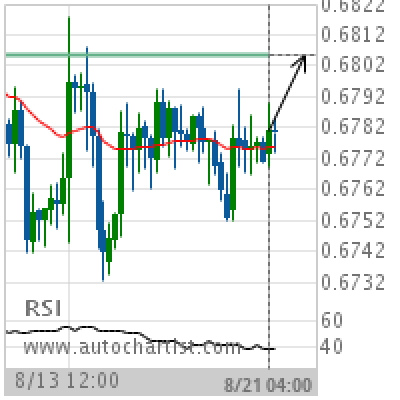
AUD/USD Target Level: 0.6806
Approaching Resistance level of 0.6806 identified at 21-Aug-2019 04:00 UTC Supported by RSI below 40 Chart 4 hourPattern ResistanceLength 78 CandlesIdentified 21-Aug-2019 04:00 UTC
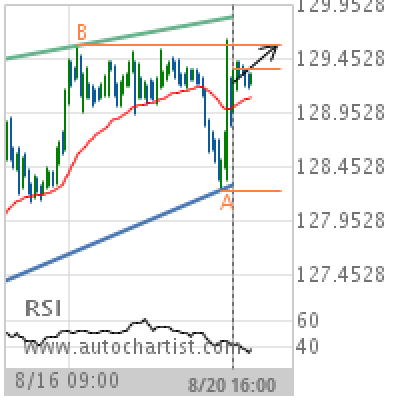
GBP/JPY Target Level: 129.5730
Rising Wedge identified at 20-Aug-2019 16:00 UTC. This pattern is still in the process of forming. Possible bullish price movement towards the resistance 129.5730 within the next 2 days. Supported by RSI below 40 Chart 1 hourPattern Rising WedgeLength 128 CandlesIdentified 20-Aug-2019 16:00 UTC
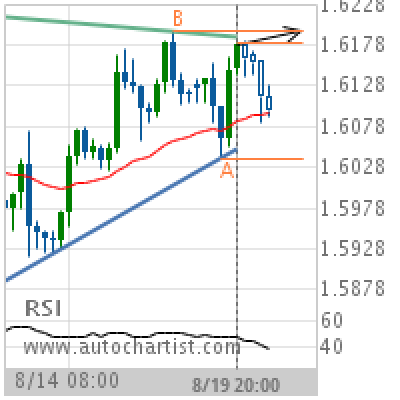
GBP/CAD Target Level: 1.6194
Triangle identified at 19-Aug-2019 20:00 UTC. This pattern is still in the process of forming. Possible bullish price movement towards the resistance 1.6194 within the next 2 days. Supported by RSI below 40 Chart 4 hourPattern TriangleLength 50 CandlesIdentified 19-Aug-2019 20:00 UTC
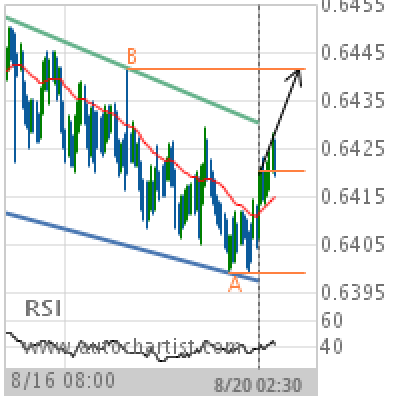
NZD/USD Target Level: 0.6442
Channel Down identified at 20-Aug-2019 02:30 UTC. This pattern is still in the process of forming. Possible bullish price movement towards the resistance 0.6442 within the next day. Supported by Upward sloping Moving Average Chart 30 MinutesPattern Channel DownLength 188 CandlesIdentified 20-Aug-2019 02:30 UTC
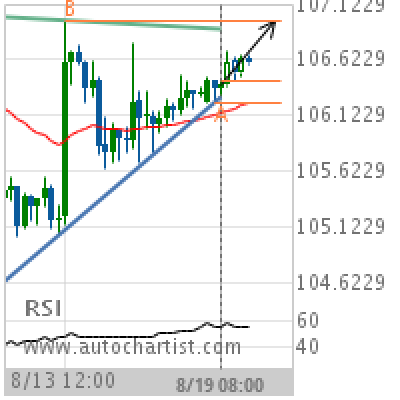
USD/JPY Target Level: 106.9740
Triangle identified at 19-Aug-2019 08:00 UTC. This pattern is still in the process of forming. Possible bullish price movement towards the resistance 106.9740 within the next 2 days. Supported by Upward sloping Moving Average Chart 4 hourPattern TriangleLength 56 CandlesIdentified 19-Aug-2019 08:00 UTC
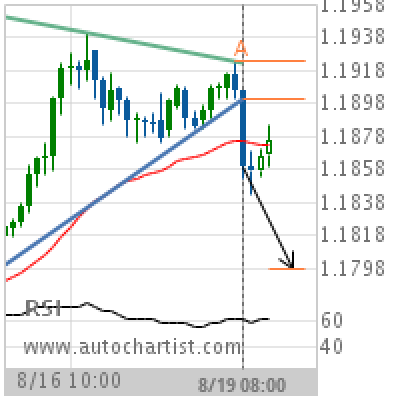
GBP/CHF Target Level: 1.1798
Triangle has broken through the support line at 19-Aug-2019 08:00 UTC. Possible bearish price movement forecast for the next 13 hours towards 1.1798. Supported by RSI above 60 Chart 1 hourPattern TriangleLength 50 CandlesIdentified 19-Aug-2019 08:00 UTC

