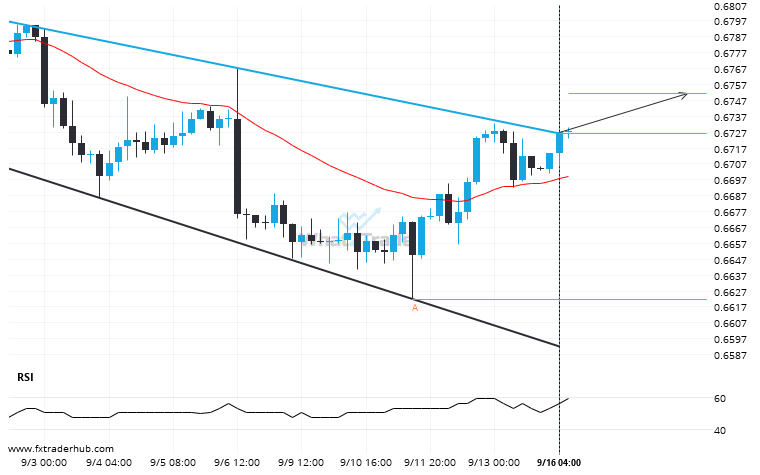
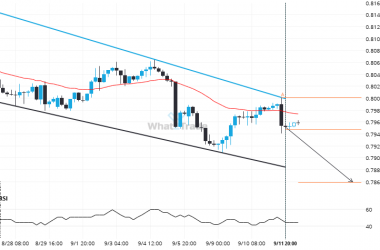
AUD/USD moved through the resistance line of a Channel Down at 0.6726166666666665 on the 4 hour chart. This line has been tested a number of times in the past and this breakout could mean an upcoming change from the current trend. It may continue in its current direction toward 0.6751.
Related Posts
If you’re long USDCHF you should be aware of the rapidly approaching level of 0.8102
USDCHF is moving towards a key support level at 0.8102. USDCHF has previously tested this level 5 times…
Breach of support could mean a start of a bearish trend on EURGBP
EURGBP moved through the support line of a Triangle at 0.851723043478261 on the 4 hour chart. This line…
Rare set of bearish consecutive candles on the AUDCAD Daily chart. Can we expect a turn-around?
AUDCAD has moved lower after 5 consecutive daily candles from 0.8928 to 0.8811 in the last 5 days.