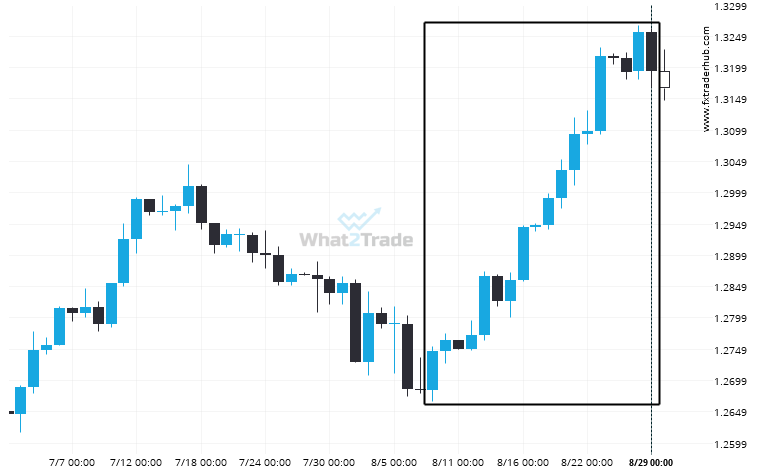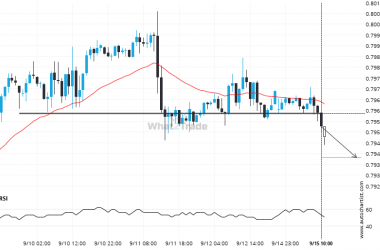
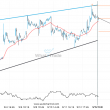
Those of you that are trend followers are probably eagerly watching GBP/USD to see if its latest 3.51% move continues. If not, the mean-reversion people out there will be delighted with this exceptionally large 22 days move.
An unexpected large move has occurred on GBP/USD Daily chart! Is this a sign of something new? What can we expect?