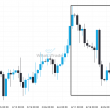
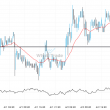
An unexpected large move has occurred on Corn May 2024 1 hour chart beginning at 434.75 and ending at 426.25. Is this a sign of something new? What can we expect in the future?
Related Posts
Natural Gas is approaching a resistance line of a Ascending Triangle. It has touched this line numerous times in the last 2 days.
Natural Gas is heading towards the resistance line of a Ascending Triangle and could reach this point within…
After testing resistance twice in the past, Silver Spot has finally broken through. Can we expect a bullish trend to follow?
You would be well advised to confirm the breakout that has just occurred – do you believe the…
Brent Crude has broken through a resistance line. It has touched this line numerous times in the last 6 days.
A strong resistance level has been breached at 68.4115 on the 30 Minutes Brent Crude chart. Technical Analysis…