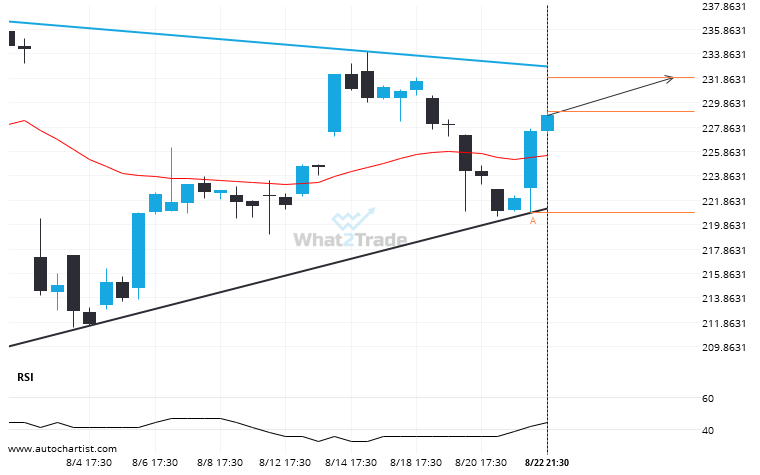
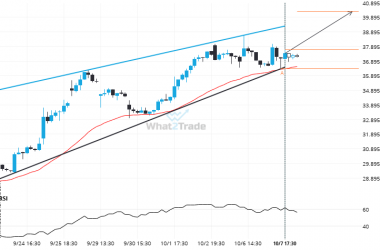
AMZN was identified at around 229.1 having recently rebounded of the support on the 4 hour data interval. Ultimately, the price action of the stock has formed a Triangle pattern. This squeeze may increases the chances of a strong breakout. The projected movement will potentially take the price to around the 231.9549 level.
AMZN is approaching a resistance line of a Triangle. It has touched this line numerous times in the last 38 days.