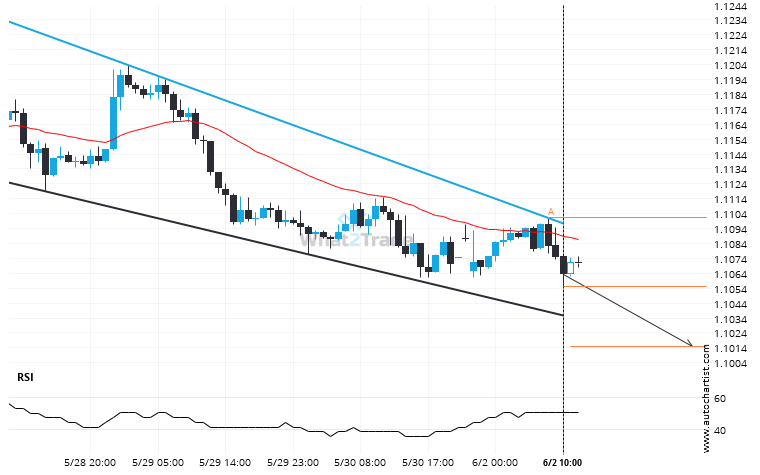
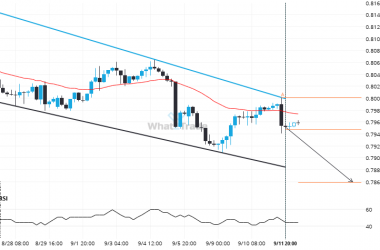
Emerging Falling Wedge pattern in its final wave was identified on the GBPCHF 1 hour chart. After a strong bearish run, we find GBPCHF heading towards the upper triangle line with a possible resistance at 1.1015. If the support shows to hold, the Falling Wedge pattern suggests a rebound back towards current levels.
Related Posts
AUDNZD has broken through a resistance line. It has touched this line numerous times in the last 8 days.
AUDNZD has broken through a resistance line. It has touched this line numerous times in the last 8…
A possible move on USDCHF as it heads towards support
USDCHF is moving towards a support line which it has tested numerous times in the past. We have…
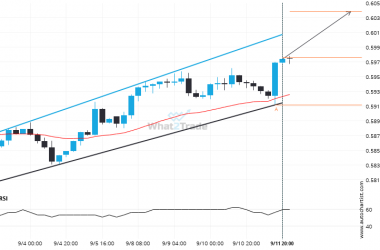
A Channel Up has formed, NZDUSD is approaching support. Can we expect a breakout and the start of a new trend or a reversal?
Emerging Channel Up pattern in its final wave was identified on the NZDUSD 4 hour chart. After a…


