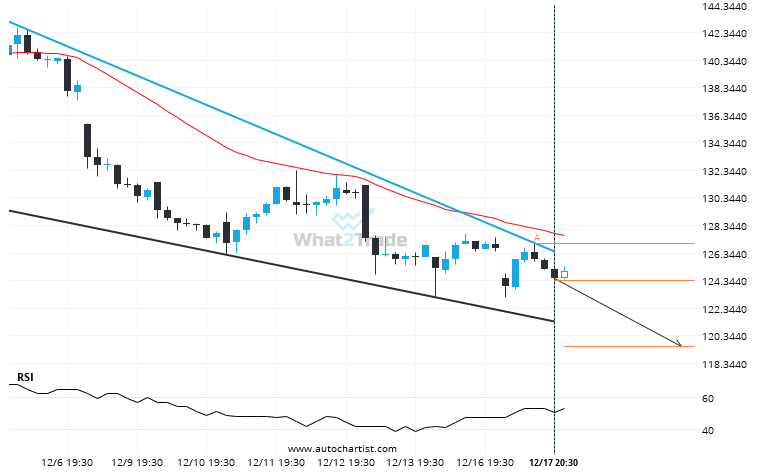
A Falling Wedge pattern was identified on AMD at 124.325, creating an expectation that it may move to the support line at 119.5518. It may break through that line and continue the bearish trend or it may reverse from that line.
Related Posts
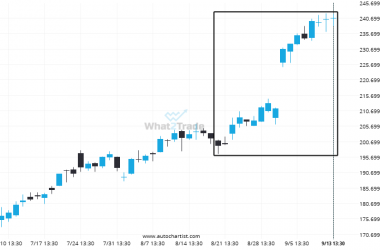
Big bullish swing on GOOGL – this may be one of its more notable movements in the recent session.
A movement of 20.79% over 25 days on GOOGL doesn’t go unnoticed. You may start considering where it’s…
META – approaching a support line that has been previously tested at least twice in the past
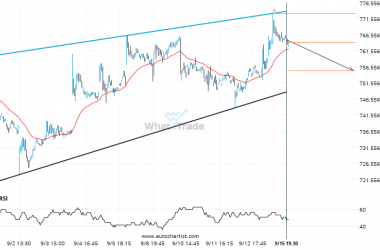
Emerging Rising Wedge detected on META – the pattern is an emerging one and has not yet broken…
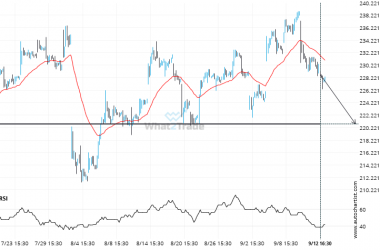
AMZN seems to be on its way to support – a possible opportunity?
AMZN is moving towards a support line. Because we have seen it retrace from this level in the…

