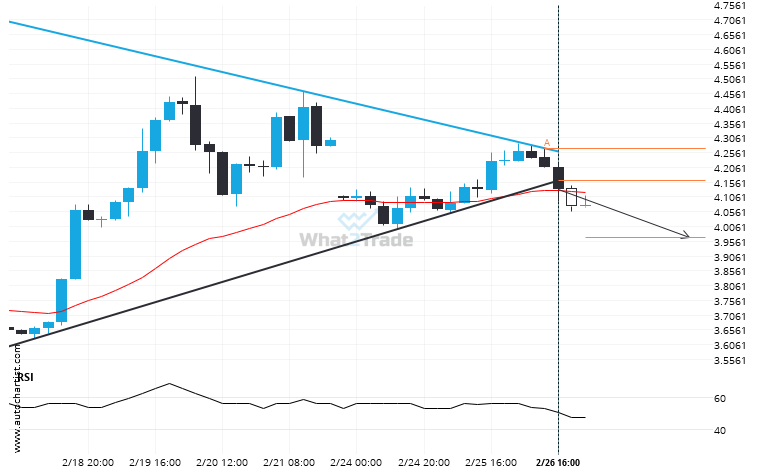
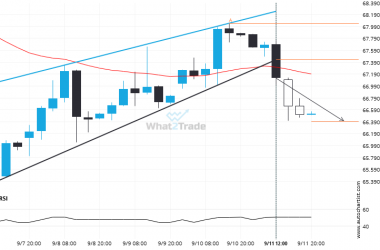
The last 17 4 hour candles on Natural Gas formed a Triangle pattern and broken out through the pattern lines, indicating a possible bearish movement towards the price level of 3.9685.
Related Posts
A possible move on Brent Crude as it heads towards support
The movement of Brent Crude towards the support line of a Channel Down is yet another test of…
Gold Spot has broken through a resistance line. It has touched this line numerous times in the last 3 days.
Gold Spot has broken through a line of 3649.8000 and suggests a possible movement to 3664.0825 within the…
Interesting opportunity on Brent Crude after breaking 67.43627777777779
Brent Crude moved through the support line of a Pennant at 67.43627777777779 on the 4 hour chart. This…


