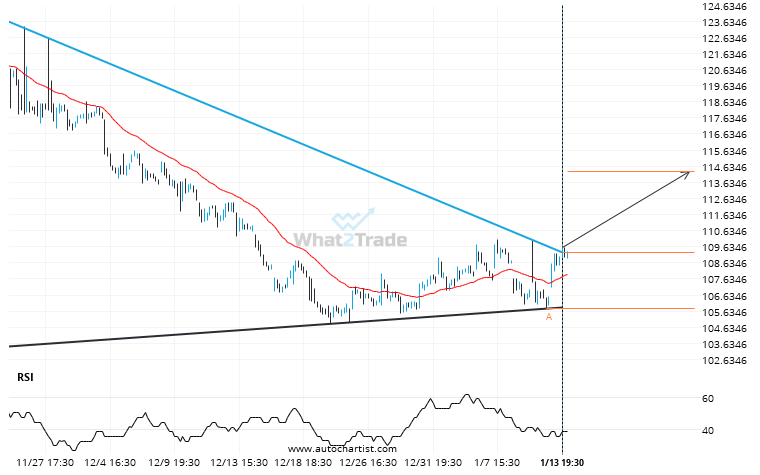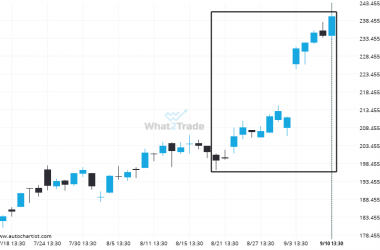
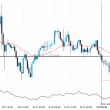
XOM has broken through a resistance line. It has touched this line at least twice in the last 61 days. This breakout may indicate a potential move to 114.3019 within the next 3 days. Because we have seen it retrace from this position in the past, one should wait for confirmation of the breakout before trading.
After testing resistance twice in the past, XOM has finally broken through. Can we expect a bullish trend to follow?