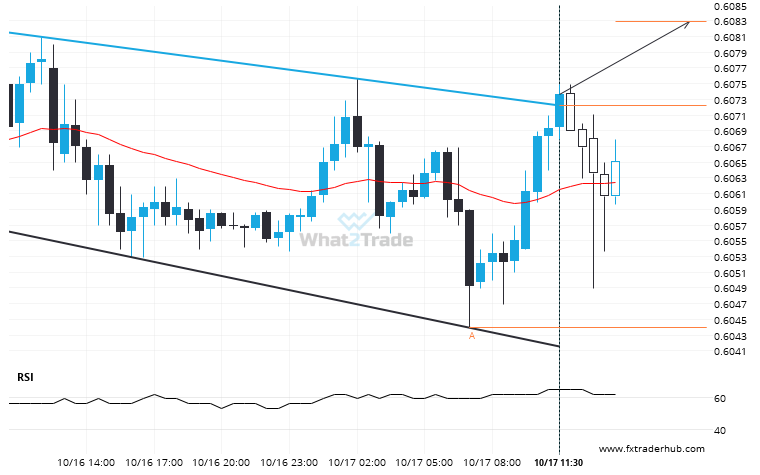
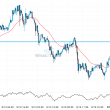
The last 2 30 Minutes candles on NZD/USD formed a Channel Down pattern and broken out through the pattern lines, indicating a possible bullish movement towards the price level of 0.6083.
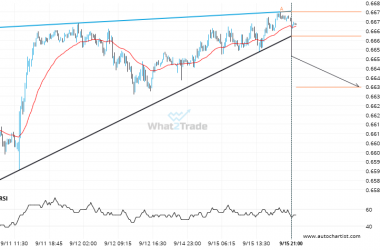
Related Posts
USDCAD has broken through a resistance line. It has touched this line numerous times in the last 19 days.
USDCAD has broken through a line of 1.3735 and suggests a possible movement to 1.3814 within the next…
Is the extremely large movement on USDCHF a sign of things to come?
A movement of 1.29% over 2 days on USDCHF doesn’t go unnoticed. You may start considering where it’s…
USDJPY – breach of a trending support line that has been tested at least twice before.
This trade setup on USDJPY is formed by a period of consolidation; a period in which the price…