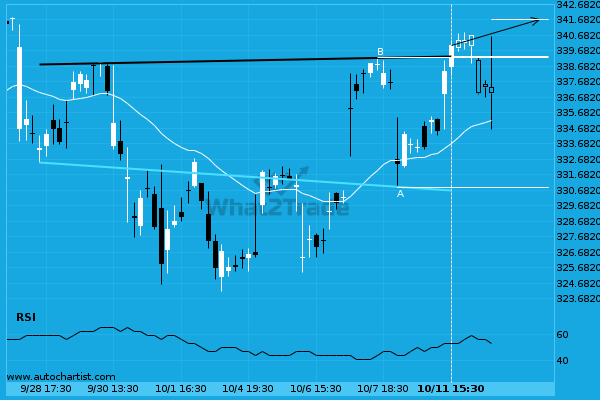
The breakout of Home Depot Inc. through the resistance line of a Inverse Head and Shoulders could be a sign of the road ahead. If this breakout persists, we expect the price of Home Depot Inc. to test 341.67 within the next 15 hours. One should always be cautious before placing a trade, wait for confirmation of the breakout before putting any money down.
After testing resistance twice in the past, Home Depot Inc. has finally broken through. Can we expect a bullish trend to follow?