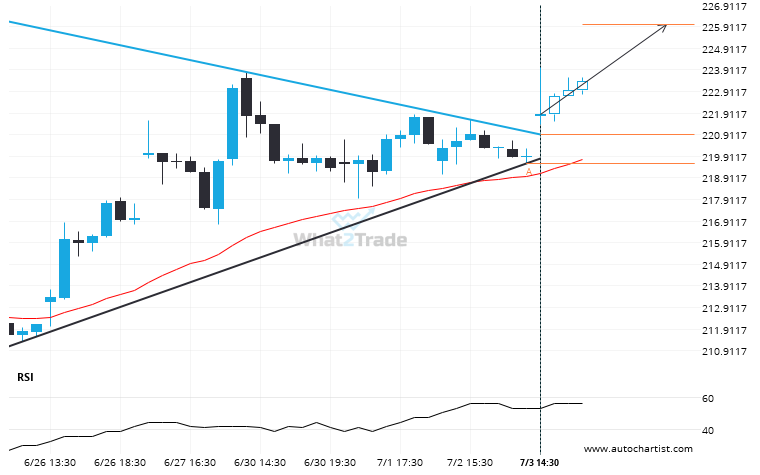
The last 9 1 hour candles on AMZN formed a Triangle pattern and broken out through the pattern lines, indicating a possible bullish movement towards the price level of 226.0096.
Related Posts
MRNA breakout from a Ascending Triangle trade setup. Will it continue this trend to hit the target price?
This trade setup on MRNA is formed by a period of consolidation; a period in which the price…
NVDA is quickly approaching a very important level it has previously tested numerous times in the past
NVDA is heading towards 184.4200 and could reach this point within the next 15 hours. It has tested…
GOOGL formed a Channel Up on the 1 hour chart. Retest of resistance in sight.
GOOGL is heading towards the resistance line of a Channel Up and could reach this point within the…


