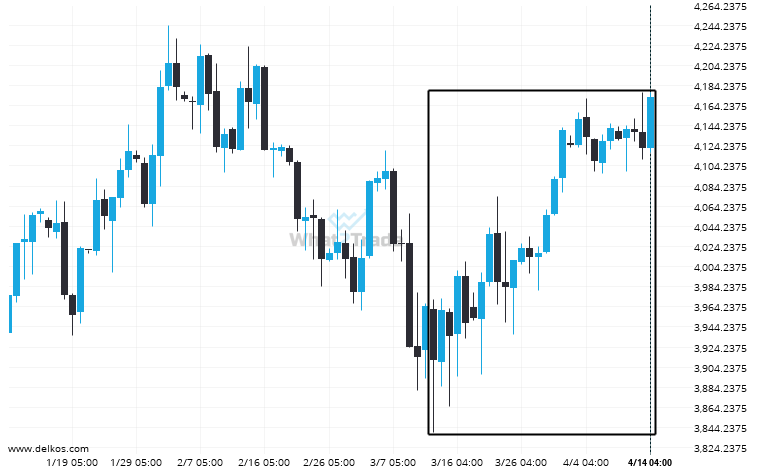
Those of you that are trend followers are probably eagerly watching E-mini S&P 500 JUNE 2023 to see if its latest 6.7% move continues. If not, the mean-reversion people out there will be delighted with this exceptionally large 33 days move.
Related Posts
An unexpected large move has occurred on Natural Gas Daily chart! Is this a sign of something new? What can we expect?
Natural Gas hits 3.033 after a 25.87% move spanning 23 days.
Important price line being approached by Silver Spot. This price has been tested numerous times before.
Silver Spot is heading towards a line of 32.9415. If this movement continues, the price of Silver Spot…
Natural Gas formed a Channel Down on the 1 hour chart. Retest of resistance in sight.
An emerging Channel Down has been detected on Natural Gas on the 1 hour chart. There is a…