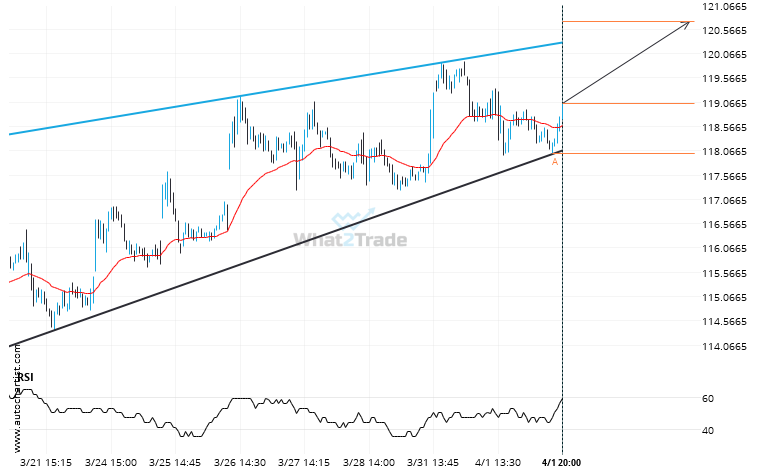
Emerging Rising Wedge pattern in its final wave was identified on the XOM 15 Minutes chart. After a strong bullish run, we find XOM heading towards the upper triangle line with a possible resistance at 120.7314. If the resistance shows to hold, the Rising Wedge pattern suggests a rebound back towards current levels.
Related Posts
Because AMD formed a Channel Up pattern, we expect it to touch the resistance line. If it breaks through resistance it may move much higher
AMD is moving towards a resistance line which it has tested numerous times in the past. We have…
BIDU experienced 4 consecutive 4 hour bearish candles to reach a price of 86.9300
Due to the rate of consecutive bearish candles on BIDU 4 hour chart we could be in for…
PYPL may be on a start of a new bearish trend after its breakout through this important support level
PYPL has broken through 73.8550 which it has tested numerous times in the past. We have seen it…