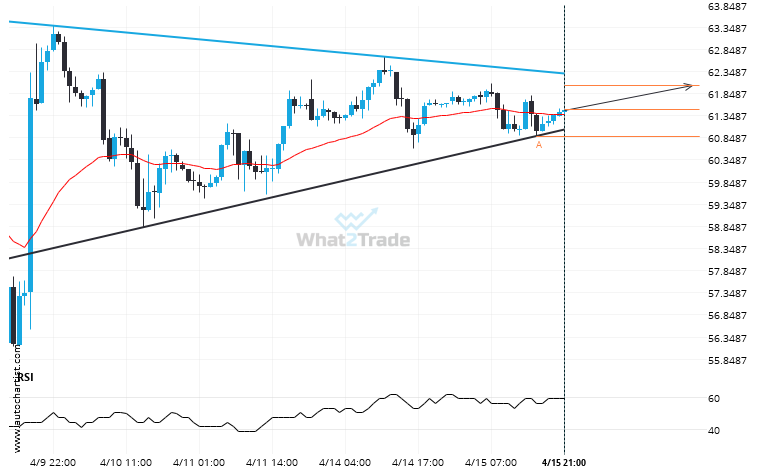
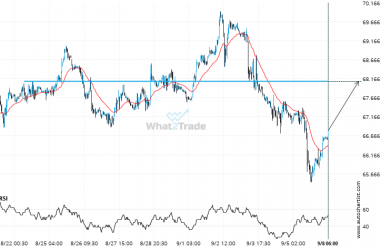
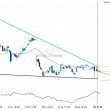
US Oil was identified at around 61.4895 having recently rebounded of the support on the 1 hour data interval. Ultimately, the price action of the stock has formed a Triangle pattern. This squeeze may increases the chances of a strong breakout. The projected movement will potentially take the price to around the 62.0326 level.
Related Posts
Gold Spot formed a Channel Up on the 1 hour chart. Retest of support in sight.
Gold Spot is moving towards a support line which it has tested numerous times in the past. We…
Natural Gas is signaling a possible trend reversal on the intraday charts with price not breaching support.
Natural Gas is heading towards the resistance line of a Rising Wedge. If this movement continues, the price…
Important price line being approached by Brent Crude. This price has been tested numerous times before.
Brent Crude is moving towards a resistance line. Because we have seen it retrace from this level in…