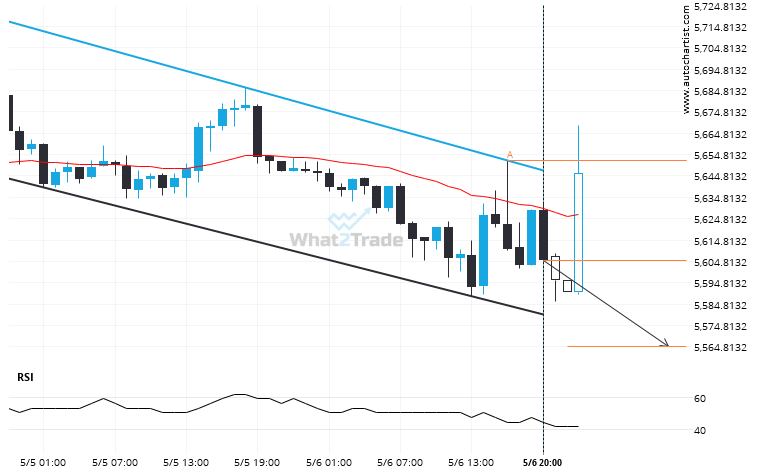
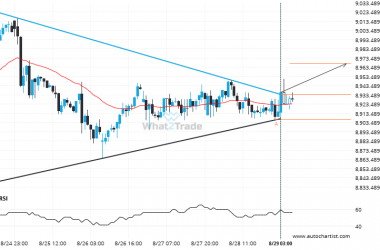
US 500 is heading towards the support line of a Channel Down and could reach this point within the next 10 hours. It has tested this line numerous times in the past, and this time could be no different from the past, ending in a rebound instead of a breakout. If the breakout doesn’t happen, we could see a retracement back down to current levels.
Related Posts
Supports and resistances are primary concepts of technical analysis. DAX 40 is heading for an important price of 23798.8008 – read about what this could mean for the future.
A strong support level has been identified at 23798.8008 on the 30 Minutes DAX 40 chart. DAX 40…
Breach of resistance could mean a start of a bullish trend on CAC 40
Triangle pattern identified on CAC 40 has broken through a resistance level with the price momentum continuing to…
Important price line being approached by FTSE 100. This price has been tested numerous times before.
FTSE 100 is moving towards a key support level at 9090.7998. FTSE 100 has previously tested this level…