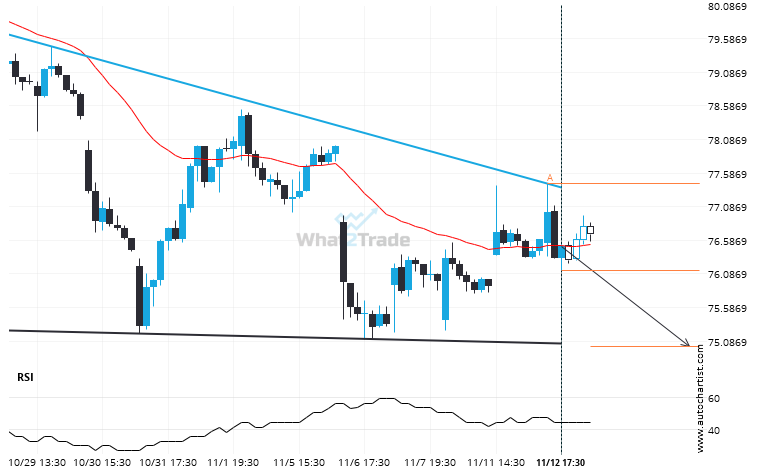
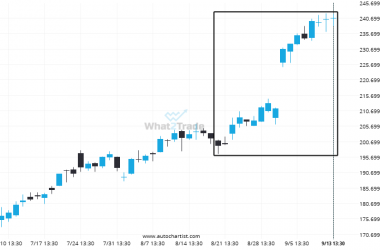
A Descending Triangle pattern was identified on NKE at 76.14, creating an expectation that it may move to the support line at 75.0052. It may break through that line and continue the bearish trend or it may reverse from that line.
Related Posts
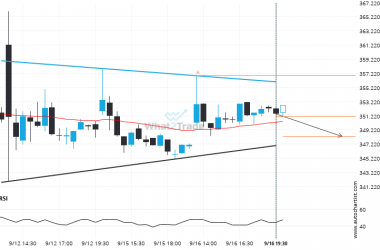
ADBE is approaching a support line of a Triangle. It has touched this line numerous times in the last 6 days.
An emerging Triangle has been detected on ADBE on the 30 Minutes chart. There is a possible move…
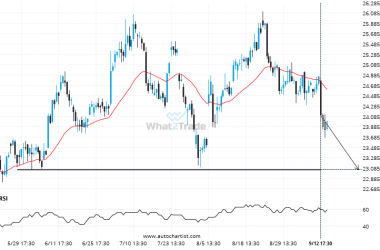
Will PFE break through the support level it tested before?
PFE is heading towards 23.0550 and could reach this point within the next 3 days. It has tested…
Big bullish swing on GOOGL – this may be one of its more notable movements in the recent session.
A movement of 20.79% over 25 days on GOOGL doesn’t go unnoticed. You may start considering where it’s…

