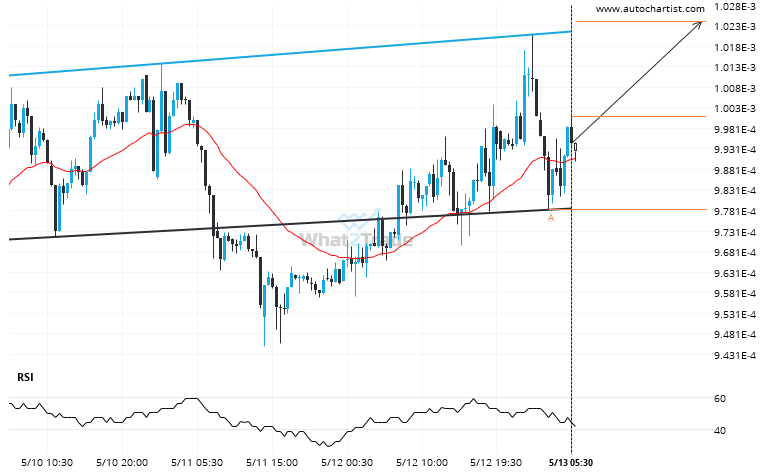
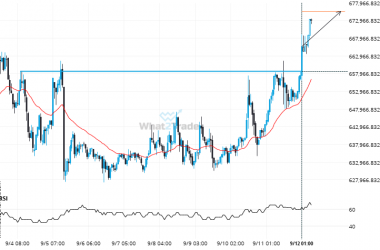
A Inverse Head and Shoulders pattern was identified on LTCBTC at 0.001001, creating an expectation that it may move to the resistance line at 1.0242E-03. It may break through that line and continue the bullish trend or it may reverse from that line.
Related Posts
Extreme movement experienced on ETHJPY. Check this chart to see what to do next
ETHJPY hits 366972.61 after a 46.44% move spanning 21 days.
DASHEUR is quickly approaching a very important level it has previously tested numerous times in the past
The price of DASHEUR in heading back to the support area. It is possible that it will struggle…
Could a large bullish move on LTCAUD be a sign of things to come?
LTCAUD experienced an extremely large move that lasted 25. This movement is in the 95.0 percentile and is…