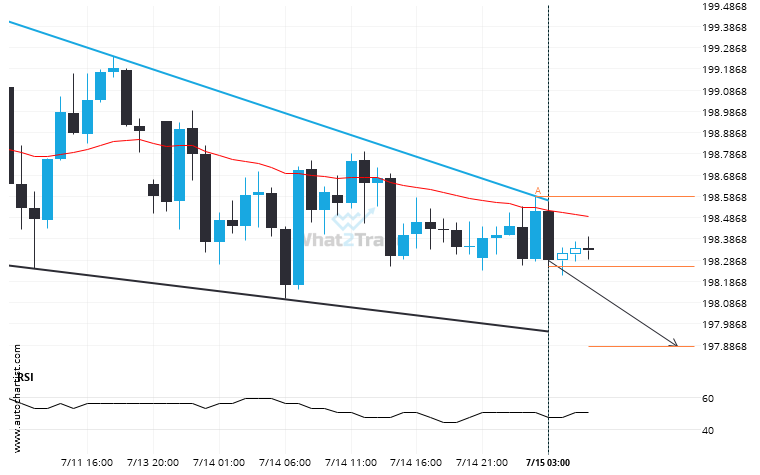
Emerging Falling Wedge pattern in its final wave was identified on the GBPJPY 1 hour chart. After a strong bearish run, we find GBPJPY heading towards the upper triangle line with a possible resistance at 197.8798. If the support shows to hold, the Falling Wedge pattern suggests a rebound back towards current levels.
Related Posts
Because USDJPY formed a Channel Down pattern, we expect it to touch the resistance line. If it breaks through resistance it may move much higher
USDJPY is heading towards the resistance line of a Channel Down and could reach this point within the…
A Channel Up has formed, EURUSD is approaching resistance. Can we expect a breakout and the start of a new trend or a reversal?
EURUSD is trapped in a Channel Up formation, implying that a breakout is Imminent. This is a great…
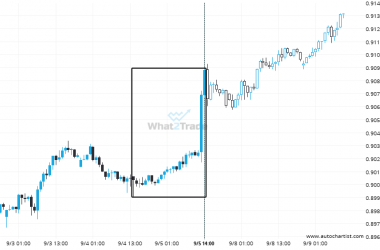
A very large move was recorded on AUDCAD. The size of the shift is exceptional.
AUDCAD reached 0.909115 after a 0.94% move spanning 2 days.


