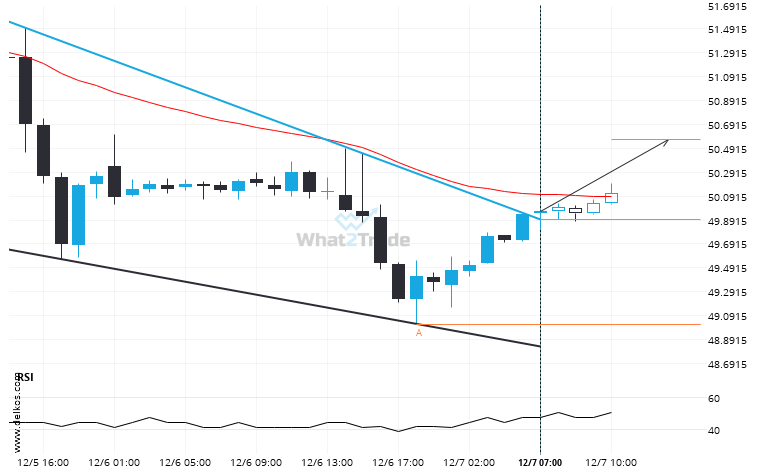
Soybean Oil January 2024 has broken through a resistance line of a Falling Wedge chart pattern. If this breakout holds true, we may see the price of Soybean Oil January 2024 testing 50.5636 within the next 5 hours. But don’t be so quick to trade, it has tested this line in the past, so you should confirm the breakout before taking any action.
Related Posts
Gold Spot seems to be on its way to resistance – a possible opportunity?
Gold Spot is approaching a resistance line at 3871.7600. If it hits the resistance line, it may break…
Important support line being approached by US Oil. This price has been tested numerous time in the last 8 days
An emerging Falling Wedge has been detected on US Oil on the 30 Minutes chart. There is a…
Because Gold Spot formed a Channel Up pattern, we expect it to touch the support line. If it breaks through support it may move much lower
Gold Spot is moving towards a support line. Because we have seen it retrace from this line before,…

