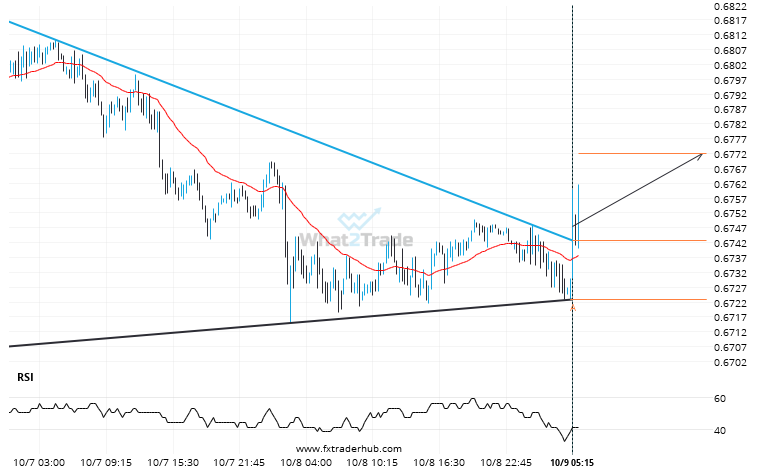
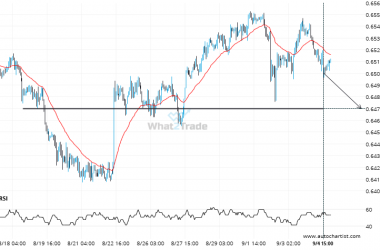
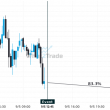
AUD/USD has broken through the resistance line of a Triangle technical chart pattern. Because we have seen it retrace from this line in the past, one should wait for confirmation of the breakout before taking any action. It has touched this line twice in the last 5 days and suggests a possible target level to be around 0.6772 within the next 16 hours.
Related Posts
GBPCHF through 1.132424054054054. Is this a confirming a breakout? Will it continue its path in the current trend toward 1.1261?
The breakout of GBPCHF through the support line of a Triangle could be a sign of the road…
After experiencing a 2.87% bearish move in the space of 11 days, nobody knows where USDCHF is headed.
USDCHF hits 0.87735 after a 2.87% move spanning 11 days.
After trying numerous times in the past, EURGBP finally breaks 0.8392!
The price of EURGBP in heading in the direction of 0.8371. Despite the recent breakout through 0.8392 it…